Day of the Week effect (TDW)
Day of the Week effect is investigated through Ticker's return in the different Weekdays (Monday = 1, Sunday = 7).
ForecastCycles TDW Strategies
In ForecastCycles potential TDW anomalies are investigated through 3 families of Strategies:
- TDW strategy
- enters at the opening price of a weekday and
- closes the position at the closing price of the same weekday.
- For example, if the TDW tactic is "1", the Ticker is
* bought at the opening price of Monday and
* sold at the closing price of the same Monday.
- TDW_ovn strategy
- enters at the opening price of a weekday,
- keeps the position overnight 1 night, and
- closes the position at the opening price of the following trading day.
- For example, if the TDW_ovn tactic is "1", the Ticker is
- bought at the opening price of Monday and
- sold at the opening price of Tuesday.
- TDW_multi strategy
- enters at the opening price of a weekday,
- keeps the position overnight N nights
- closes the position at the closing price of another weekday.
- For example, if the TDW_multi tactic is "123", the Ticker is
- bought at the opening price of Monday and
- sold at the closing price of Wednesday.
The impact of Trading Costs
In short term trading, like a TDW strategy is commission and spread have a heavy impact, causing in most cases positive gross returns but negative net returns
So, is better to use instruments with low spread and commissions, two of them are:
- Futures
- derivatives largely traded by banks with a commission of a half of a basis point;
- they also exist mini-Futures that move a smaller amount of money.
- CFD
- derivatives quoted by each Broker, that have a different commission profile according to individual Broker's policy, which is generally low.
- Many retail Brokers offer zero commission costs, the unique costs are the Bid-Ask spread and the overnight fee, making them very useful for TDW strategies.
Retail traders usually trade the mini-Futures and CFDs.
Literature review
In literature the day of the week effect is called “DOW” (Day of Week) and less often TDW (“Trading Day of the Week). To avoid the confusion with “the Dow”, the Dow Jones Industrial Average I prefer to call them “TDW”.
Mood fluctuation in Weekdays
Groups of People with strongest mood fluctuation in Weekdays
Citing Birru from its paper "Day of the week and the cross-section of returns“, the week is a source of temporal organization and strongly influences the organization and structure of our activities:
The week it is not associated with environmental factors in the same way as the month of the year is. For instance, weekends aren’t associated with more sunshine than weekdays. Rather, mood fluctuations across days of the week result from lifestyle and sociocultural factors.
The week is the source of much temporal organization and strongly influences the organization and structure of our activities. Consistent with this, day-of-the-week variation in mood is more strongly exhibited in:
- people who are not retired (Stone, Schneider, and Harter, 2012)
- full-time workers than part-time workers (Helliwell and Wang, 2015), and
- employed than unemployed (Young and Lim, 2014).
Mood through Tweets
Golder and Macy in 2011 published their paper “Diurnal and Seasonal Mood Vary with Work, Sleep, and Daylength Across Diverse Cultures”.
They used textual analysis of Twitter data, by using a sample of 2.4 million individuals making over 500 million tweets from February 2008 through January 2010, to identify average mood across each hour of the day for each day of the week, measuring mood through Linguistic Inquiry and Word Count.
- The average Twitter user appear to be representative of the typical stock market participant since Twitter users are more adult people than average.
- Focusing on the average mood, measured from 3pm to 4pm of NY, to capture the mood at the daily close of the market, and consistent with past findings, the level of positive mood is the lowest on Monday and highest on Friday.
The Weekend Effect
The most documented effect in literature about TDW anomalies is the “Weekend Effect”, a phenomenon in financial markets in which stock returns on Mondays are often significantly lower than those of the immediately preceding Friday.
This fact is anomalous for some authors because for example, in a historical appreciating instrument like an US stock index, Monday should have greater return on average, because it should incorporate the returns of 3 positive days: Saturday, Sunday, and Monday itself, and since the long-term trend of US Stock Market has been increasing, all 3 days should have positive returns. The logic is that even if the exchanges are closed, there should be an increased demand of the asset in these days that should be incorporated in Monday’s return.
Monday and Friday effects
The other two most documented effects are Monday effect and Friday effect on US Stock Indices.
Until 90’s, Stock Indices had average returns:
- on Monday significantly negative, and
- on Friday significantly positive with respect to the other TDW returns.
The explanation could be linked to the mood of the investor:
- before the weekend they tend to feel a better mood, so they are more inclined to risk.
- On Monday, when they come back to work, they feel a bit more depressed and less aware on what happened during the weekend, especially if some negative news has been announced, so they are more averse to risk.
After 90’s for Monday, and 2000 for Friday returns, the day of week anomaly in S&P 500 vanished.
TDW effect in Chinese Monday returns
Alia and Ülküb in their 2019 paper “Another Look at Calendar Anomalies” found that Monday effect is different in China, instead of being negative it is positive, especially regarding small-cap stocks:
“In contrast to the well-known pattern of negative/low Monday returns, Chinese stocks earn positive/higher returns early in the week, which are more pronounced in small-cap, less-profitable (speculative) stocks, and stocks with lack of institutional investor domination. As in US there is on Monday a higher volatility.”
TDW effect in US Small-Cap Stocks
Birru in his 2018 paper “Day of the week and the cross-section of returns“, using US speculative stocks data from July of 1963 to December of 2013, found that speculative stocks earn low return on Mondays and high return on Fridays.
These findings are attributable to the variation in mood across days of the week, with a decreased mood on Mondays, that consequently leads to a relatively low returns for speculative stocks, and an increased mood on Fridays that leads to relatively high returns for speculative stocks.
He defines a speculative stocks as “the subset of stocks predicted to be most strongly affected by investor sentiment: small, young, high volatility, unprofitable, non-dividend paying, lottery-like, distressed, extreme growth, low-priced, lottery-like".
Intraday vs Overnight returns
Birru in his 2018 paper “Day of the week and the cross-section of returns“, using data of US stocks (NYSE, AMEX, Nasdaq), from Jul.1992 to Dec.2013, computed:
- intraday returns are calculated using the open(t) and close(t) prices, while
- overnight returns are calculated using the close(t) and the open(t+1).
He found that there is a significant anomaly regarding Monday and Friday returns attributable to mood variation. Instead, he showed that there is not a significant variation in the overnight returns, although most of the firm-specific news is released outside of trading hours.
In addition, he found that the anomalies tend to be strongest in speculative stocks, recognizable also by low institutional ownership. He states that all the variation on Monday and Friday anomaly returns occurs intraday.
“The intraday analysis shows that during the day, the difference in strategy returns between Friday and Monday is statistically significant at the 1% level. There is no day-of-the-week variation in anomaly returns for the overnight period, as the difference in anomaly returns between Friday and Monday is small and typically in the opposite direction as the pattern observed for the close-to-close returns. [..]
The cross-sectional variation is strongest for firms with low institutional ownership. The evidence is consistent with an explanation in which speculative stocks experience increases in stock price concurrent with increases in sentiment (Fridays) and decreases in stock price concurrent with decreases in sentiment (Mondays).
TDW effect in Metal markets
Borowski and Lukasik in their 2017 paper “Analysis of Selected Seasonality Effects in the Following Metal Markets: Gold, Silver, Platinum, Palladium and Copper” found statistical significance on gold and copper in the overnight return between the closing price of Friday and the opening price of Monday. They analyzed daily data from 1995 to 2015, spot prices in USD.
In the table:
- the first row represents statistic test for z, the Z-score, and
- the second row is the p-value.
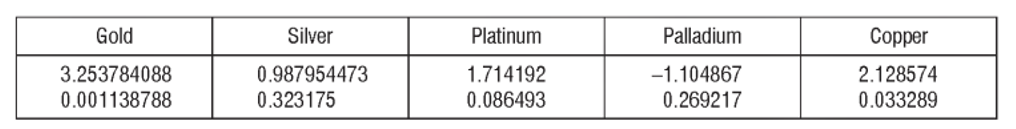
Copper is statistically significant on 0.05 confidence level (p-value of 0.033), while gold on 0.002 level (p-value of 0.00138).
That means that the chances for their return to be equal to zero in this timespan are respectively equal to 1/30 (copper) and 1/878 (gold). In other words, there are forces that drive their returns to be positive between the closing price of Friday and the opening price of Monday.
Backtest of TDW anomalies
This is a backtest I have made by choosing a set of TDW strategies on futures, having a good in-sample backtest. The criterion to choose these strategy is the in-sample period is the p-value score greater than 10, meaning meaning a p-value lower than 0.10.
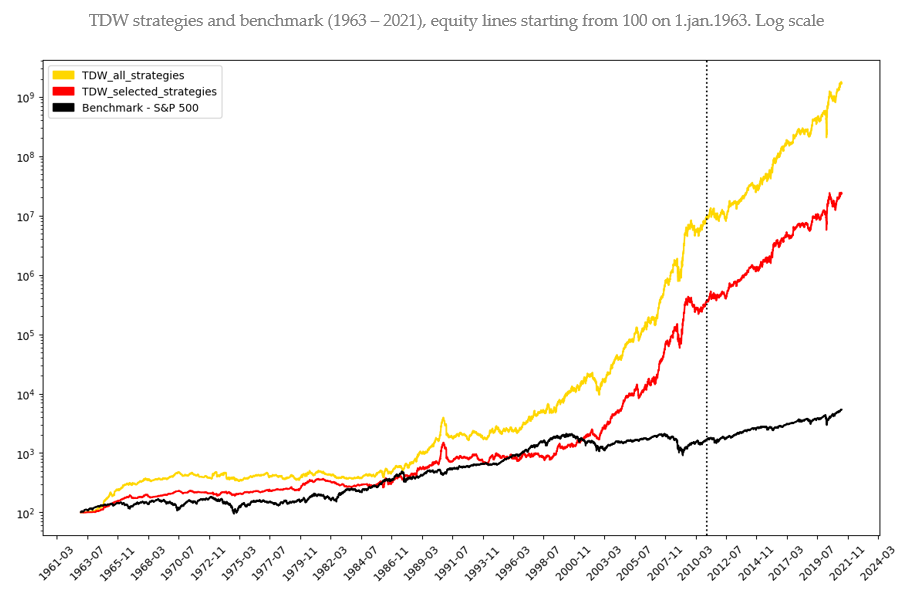
In the Chart, about the periods:
- The in-sample period goes from 1963 to 2010, while
- the out-of sample period goes from 2011 to 2021.
- The vertical line in the chart delineates the start of the out-of-sample period.
In the Chart, about the 3 lines:
- The gold line is the 'TDW All' the portfolio composed by all the TDW and TDW_ovn strategies (9 strategies), while
- the red line is the 'TDW Selected' the equitty composed by the best strategy for each weekday (5 strategies).
- The black line is the S&P 500, used as benchmark.
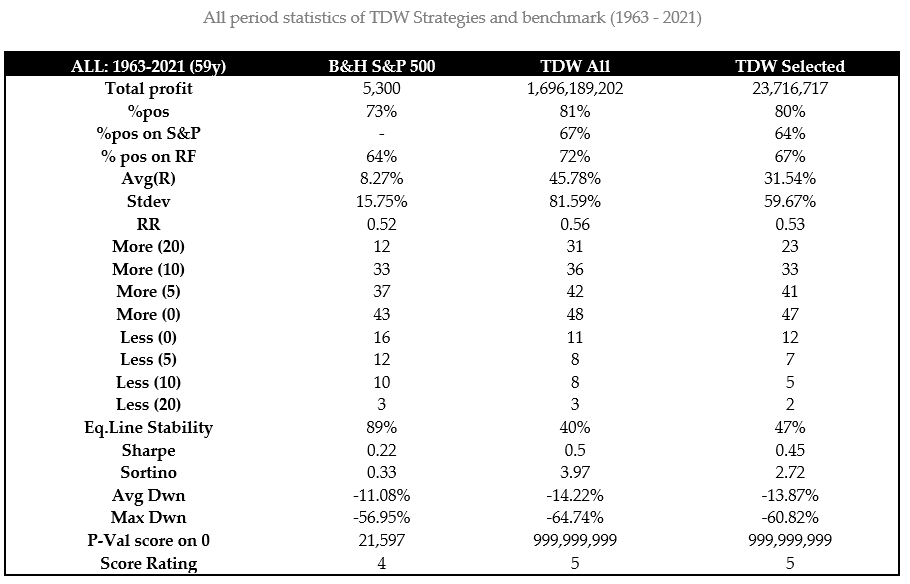
TDW strategies:
- Even if the log-scale hide them, they have had a large max drawdown (-69% and -64%). It is also true that the drawdowns are near to the max drawdown of the S&P (-60%).
- Almost every other statistic is better than the benchmark’s:
- Sharpe ratio is around 3 times bigger,
- Sortino is almost 10 times bigger, due to very few years having a negative return.
It is important to remark that these strategies can only work if trading costs are low, otherwise they would overwhelm all the positive performances.
Day of the week effect - MT4 Expert Advisor
These strategies use a very simple technique to decide the entry and the exit points. The discretion of whether buy or sell an instrument will be purely given by the day of the week (Monday = 1, Sunday = 7)
To trade automatically this anomaly, you can purchase the "TDW Expert Advisor". The Expert Advisor needs the "Main EA and libraries" to work. If you have an active ForecastCycles membership, contact us to get 20% discount.