
Within the month effect (WTM)
Within The Month effect splits the month in multiple parts and measures the returns of a Ticker in each one.
A possible explanation of this anomaly (and not only) is the irregularity of capital inflows in a market which affect asset returns.
A month can be divided in multiple parts:
ForecastCycles WTM Strategies
ForecastCycles WTM Strategies split the month is the following parts.
2 parts
The Month is divided in 2 parts:
- 1st from the 1st day of month to the 15th.
- 2nd from the 16th day to the end of the month.
The Ariel's 1987 study analyzed Dow Jones Industrial Average returns in the 2 parts of the month from 1963 to 1981. Its results shows that all monthly profit was derived from the first 15 days, in which returns, on average, were 9 times higher than the second half of the month.
3 parts
The month is divided in 3 parts:
- 1st from the 1st day of month to the 10th.
- 2nd from the 11th day to the 20th.
- 3rd from the 21th day to the end of the month.
In the paper by M.Qadan et.al “Seasonal patterns and calendar anomalies in the commodity market for natural resources”, they present studies on the commodity markets and interesting results:
“…dividing the whole month into 3 parts results in abnormal returns in the first part, but a decreasing trend in the second, and in third part returns are either very low or negative. Results demonstrating that the time-of-the-month effect does exist mainly in copper, gold, silver, zinc and oil. According to these findings, the coefficients of the returns in the second half of each month are positive and significant mainly for the period after 2004.”
4 parts
In this case the month is divided in 4 parts:
- 1st from 1st day of the month to the 7th,
- 2nd from 8th day to 15th,
- 3rd from 16th day to 23rd,
- 4th from 24th day to the end of the month.
31 parts (DOM)
The month can be divided in units:
- Days of Months (DOM), according to calendar days, up to 31;
- Trading Days Of Month (TDOM), according to business days, up to 23.
Also these effects, if they turn into anomalies, seem to be explained, at least partially, with the irregularity of private capital inflows on the market.
WTM returns of S&P 500 and Treasury Note future
In the following table there are the returns in the different monthly parts of the S&P 500 (from 1928 to 2020) and Treasury Note future (from 1982 to 2020).
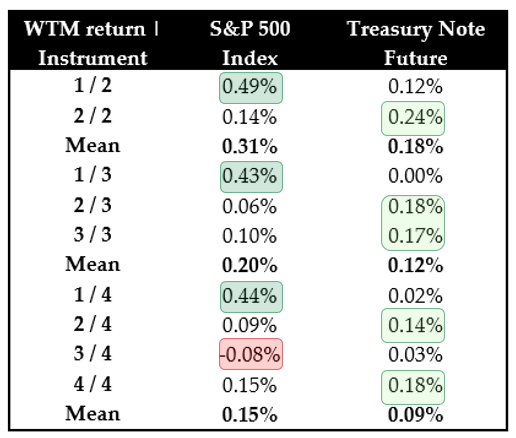
About S&P 500 returns:
- they have been a way better in the 1st half of the month: 0.49% vs 0.14% of the second half,
- but the most significant indication can be noticed by dividing the month in 4 parts: in the 1st quarter of the month is concentrated more than 2/3 of the monthly return: 0.44% vs a mean quarter return of 0.15%.
While, about Treasury Note returns:
- the 2nd half of the month has a return double (0.24%) than the one of the 1st half (0.12%);
- and the best quarters have been the 2nd (0.14%) and the 4th (0.18%), in which returns have been more than four times greater than the quarters n° 1 and 3.

Within the Month effect MT4 Expert Advisor
A behavior of a financial instrument can be studied ‘within the month’, by splitting of the month in multiple parts and measuring the returns in each one. A possible explanation of this anomaly (and not only) is the irregularity of capital inflows in a market which affect asset returns. The EA supports the month division in 2, 3 and 4 parts:
To trade automatically this anomaly, you can purchase the "WTM Expert Advisor". The Expert Advisor needs the "Main EA and libraries" to work. If you have an active ForecastCycles membership, contact us to get 20% discount.