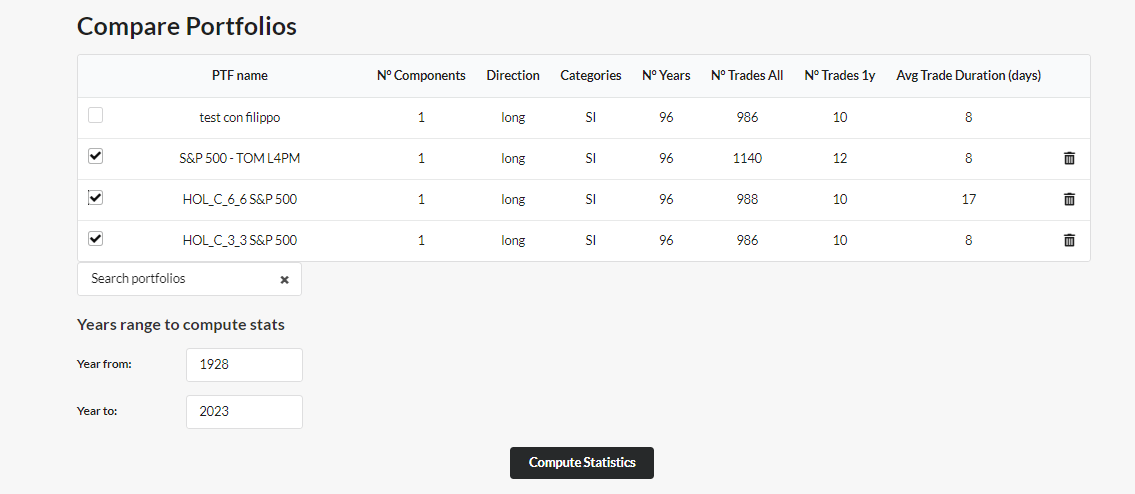
Compare Portfolios page
In this page is possible to compare the performance and the backtesting metrics of two or more Portfolios with the benchmark: the S&P 500 index.
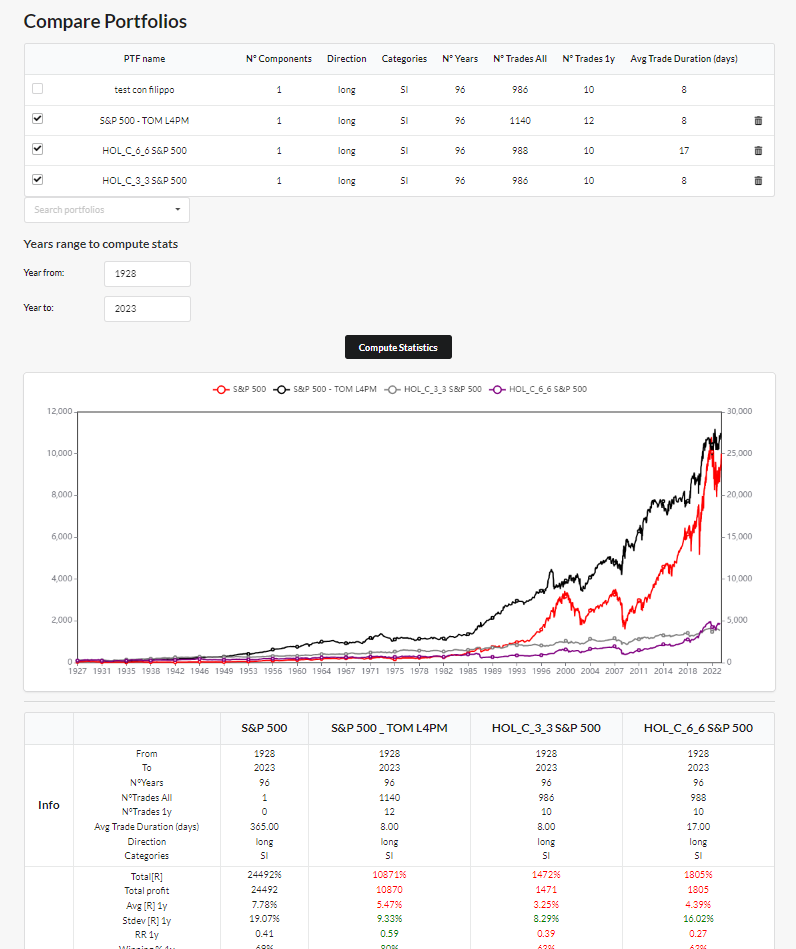
The procedure to Compare Portfolios
- when the page is loaded, in the table there are your Portfolios with computed statistics;
- through the search-box you can search and add to the table Portfolios created by other website-users;
- select the Portfolios you want to compare;
- choose the Year from and Year to, by default there are the maximum number of years available (from 1928 to the current year);
- click the Compute Statistics button to run the computations.
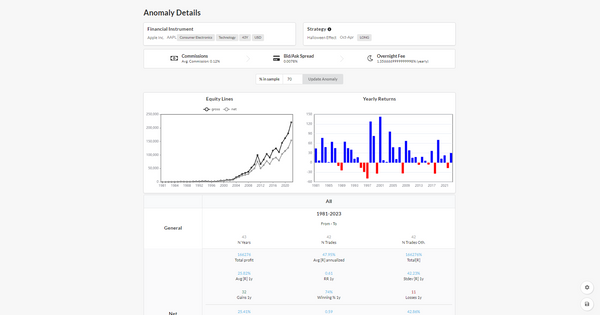
Backtest Results
The results are the same of Portfolio Details page.
The only difference here is that in this page you can have more than 2 equity lines in the chart and more than 2 columns in the statistics table, as many as selected Portfolios.
Video on YouTube
Compare Portfolios page presentation and tutorial is available on YouTube