List of Seasonal Anomalies
A Seasonal Anomaly (or Calendar Anomaly/effect) is a repetitive behavior of a financial market which appears to be related to the calendar year, such as Holidays, the day of the week, time of the month, time of the year, etc.
Introduction
Seasonal Anomalies are spotted during the night by ForecastCycles algorithms. When I'm writing, in the database there are more than 1.5 million of backtests.
Two important things to understand well Seasonal Anomalies in ForecastCycles:
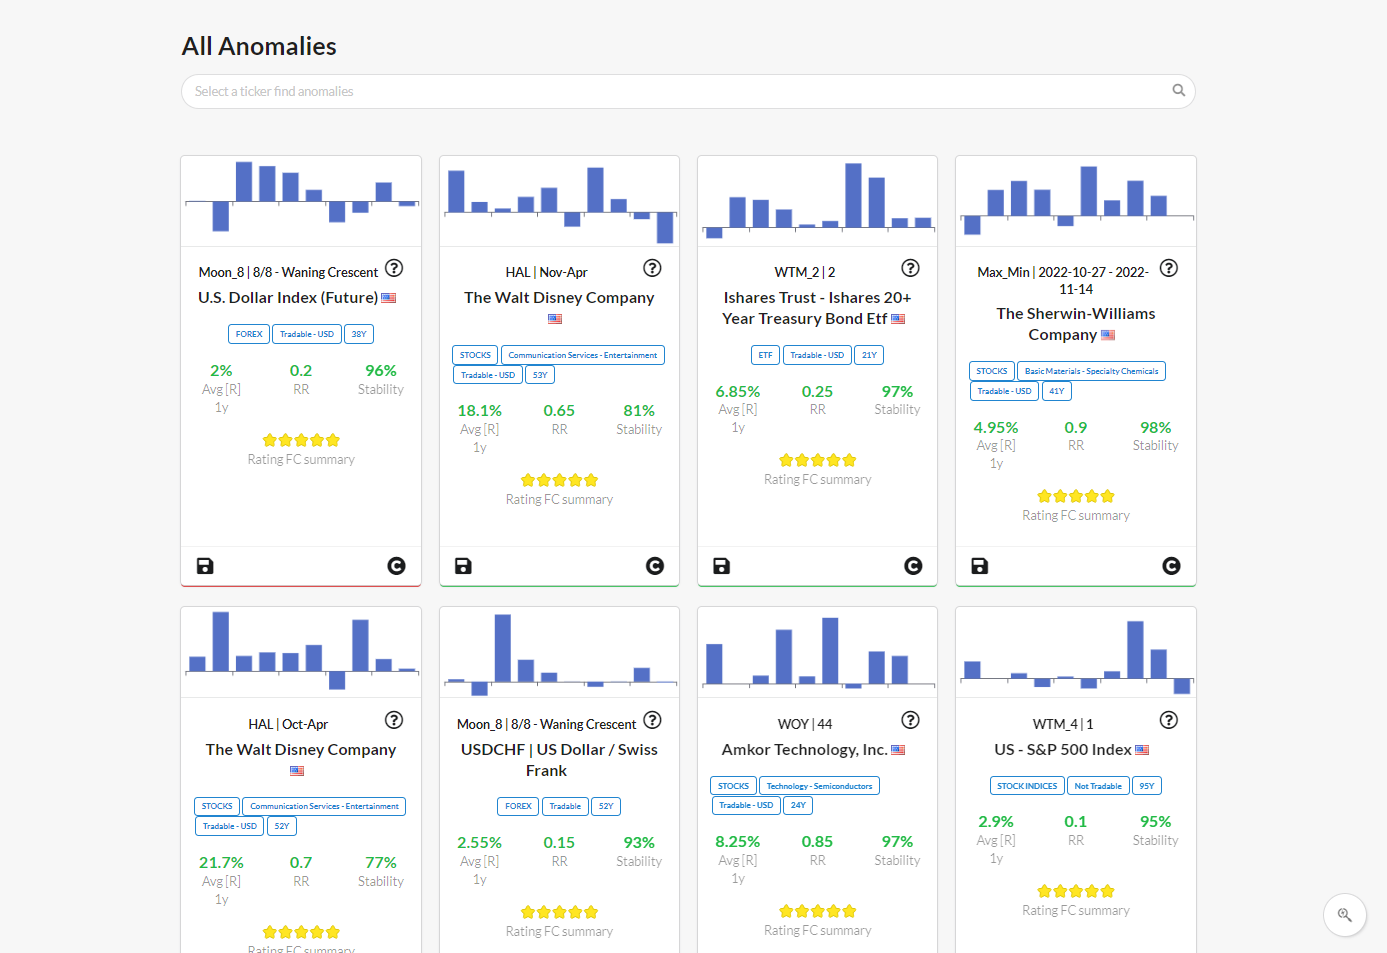
- One Anomaly (one backtest) has 4 keys:
- Ticker e.g. 'EurUsd'
- Strategy e.g. 'Monht of Year - MOY'
- Tactic e.g. '8 - August'
- Direction 'long' or 'short', e.g. 'long'
- Each Strategy has one or more Tactics.
For example, the 'Month of the Year' (MOY) strategy has 12 Tactics, the 12 months.
Seasonal Strategies
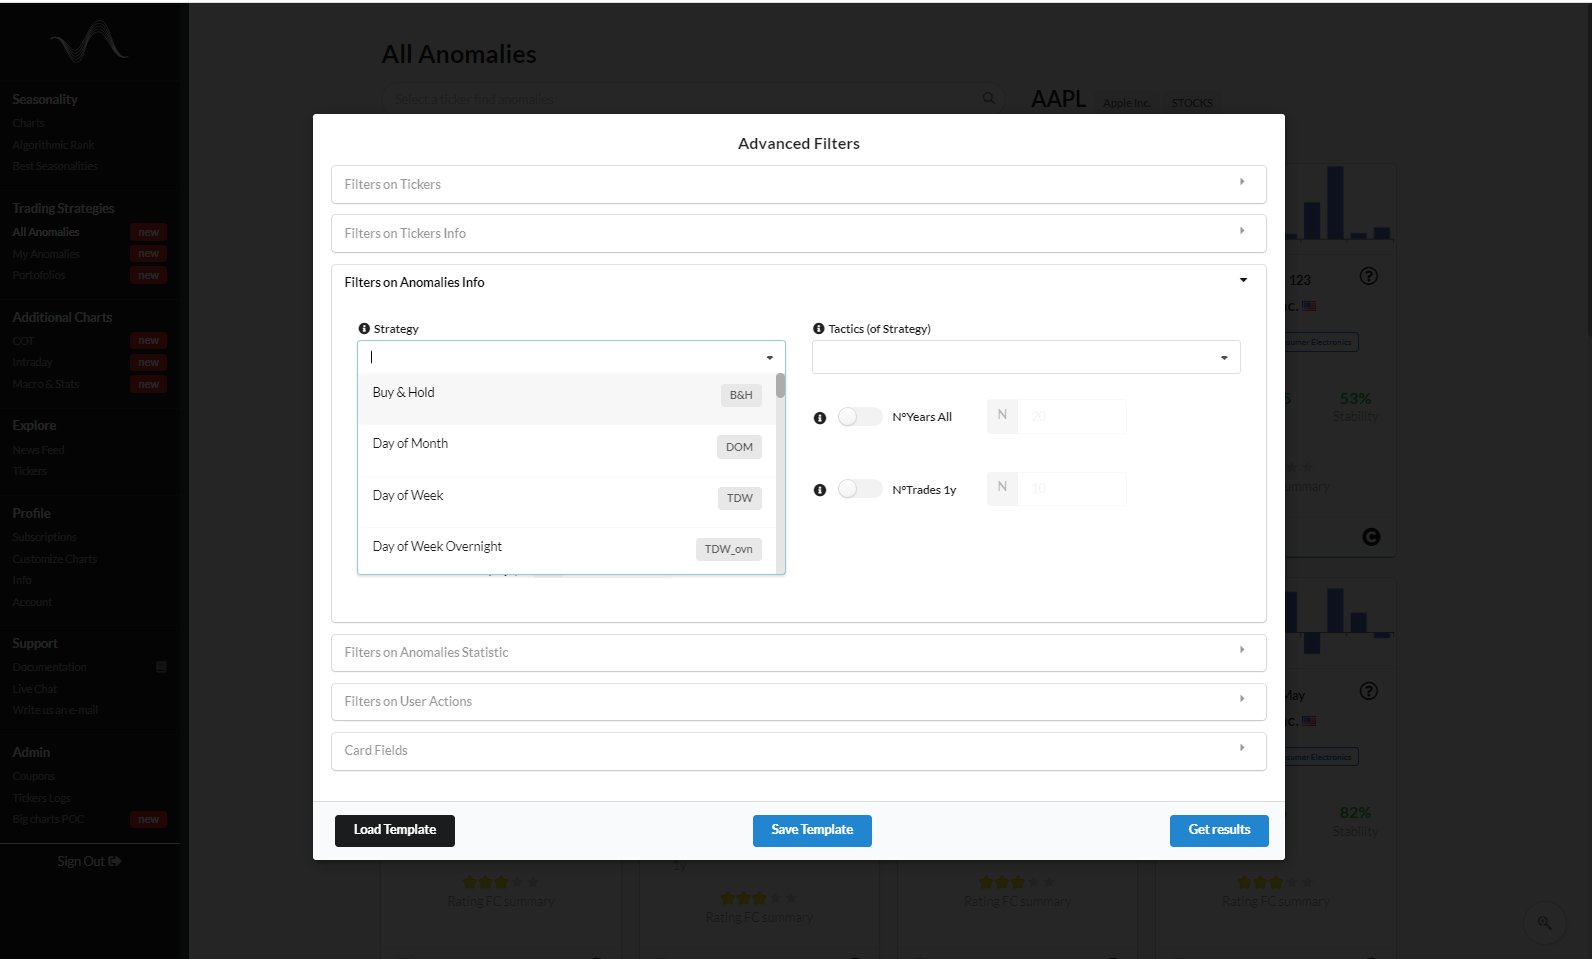
The Seasonal Strategies, available in ForecastCycles platform are:
- Day of the Month effect (DOM)
the decision to trade a Ticker (buy or sell) is given by the day of the month (from 1 to 31).
- Day of the Week effect (TDW, TDW_ovn and TDW_multi)
the discretion of whether buy or sell an instrument is given by the day of the week (Monday = 1, Sunday = 7).
- First Day of the Quarter effect (FDQ)
this strategy enters in the market at the beginning of each quarter: the 1st of Jan, Mar, Jul, Sep, and keep the position open for N days, according to the Tactic.
- Halloween effect (HAL and HAL_others)
also known as “Sell in May and go away” is a market-timing strategy based on the hypothesis (and fact) that stocks perform better between Nov.1st (Halloween) and Apr.30th, than from May to October.
- Holiday’s effect (HOL)
interesting periods to be studied are the days that precede and follow public Holidays, such as Christmas and New Year. In fact,- the days preceding Holidays are generally associated to a positive mood, which cause a greater propension to risk;
- the days following Holidays are generally associated to a negative mood and so more aversion to risk.
- January Barometer (JB)
some research argues, regarding S&P 500, that a positive January is usually associated to a positive year, instead a negative January is a predictor of a negative year.
- Lunar Cycle effect (Moon)
since moon influences natural events, it can be studied whether moon phases influence human mood and financial markets.
- Month of the Year effect (MOY and MOY_multi)
these strategies enter in the market at the beginning of a month (1: January, 12: December) and exit from it:- MOY: at the end of the same month and
- MOY_multi: at the end of one of the following months.
- Option Expiration effect (OPT)
the options expiration day and the preceding days are important dates for each market as option buyers and sellers strive to push the price in their favor when options expire.
- Season effect (SEAS)
the decision to trade a Ticker (buy or sell) is given by the day of the Season (Spring, Summer, Autumn, Winter).
- Turn of the Month effect (TOM)
Lakonishok and Smidt (1987) noted that the S&P 500 performance in the 4 days around the end of the month was 0.473%, which is 7.7 times bigger than the average of returns over a period of 4 days of S&P.
- Within the Month (WTM)
the behavior of a financial instrument is also studied ‘within the month’, by splitting the month in multiple parts and measuring the returns in each one. A possible explanation of this anomaly (and not only) is the irregularity of capital inflows in a market which affect asset returns.
- Week of the Year effect (WOY)
the calendar year is splitted into 52 weeks and it is analyzed the return in each week.
- Within the Year effect (WTY or Max-Min)
every financial instrument can have a different timespan in a calendar year in which its returns are significantly positive or negative. This effect is spotted by finding the most relevant Seasonality Highs and Lows.
Videos on YouTube
Seasonal Anomaly strategy presentations are available on YouTube
Conclusion
Seasonal anomalies are statistics that can provide opportunities to build and optimize manual and automated trading strategies.
ForecastCycles Platform allows to spot the best Anomalies to build Portfolios of trading strategies.
Create a free-account to explore Seasonal Anomalies, and decide later whether to become a premium-member, to unlock all Anomalies and more.