Best Seasonalities page
Best Seasonalities page has the ranking of the Tickers sorted by the correlation to their Best Seasonality.
Seasonality is a component of financial instruments returns, and there can be Tickers in which the Seasonal component influences more, others where it impacts less.
The more a Ticker price evolution is moving close to a Seasonality, the more the Seasonality is having an impact, and the more is likely that the Tiker will continue to follow that path.
The Ranking
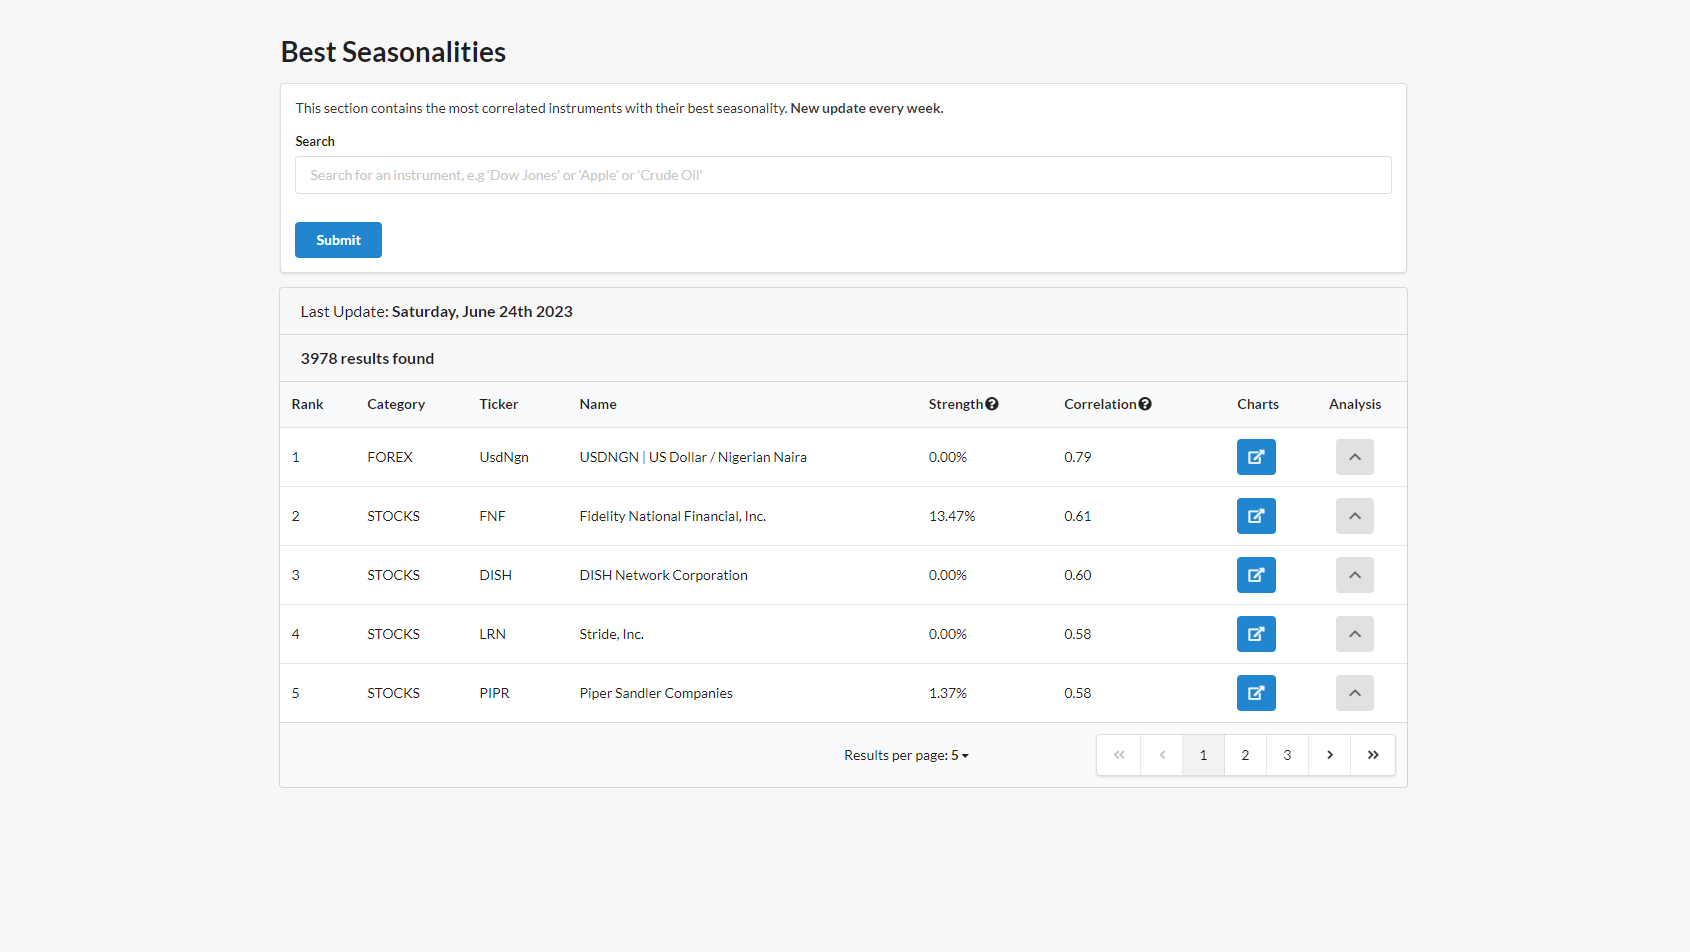
The Ranking table:
- is updated weekly
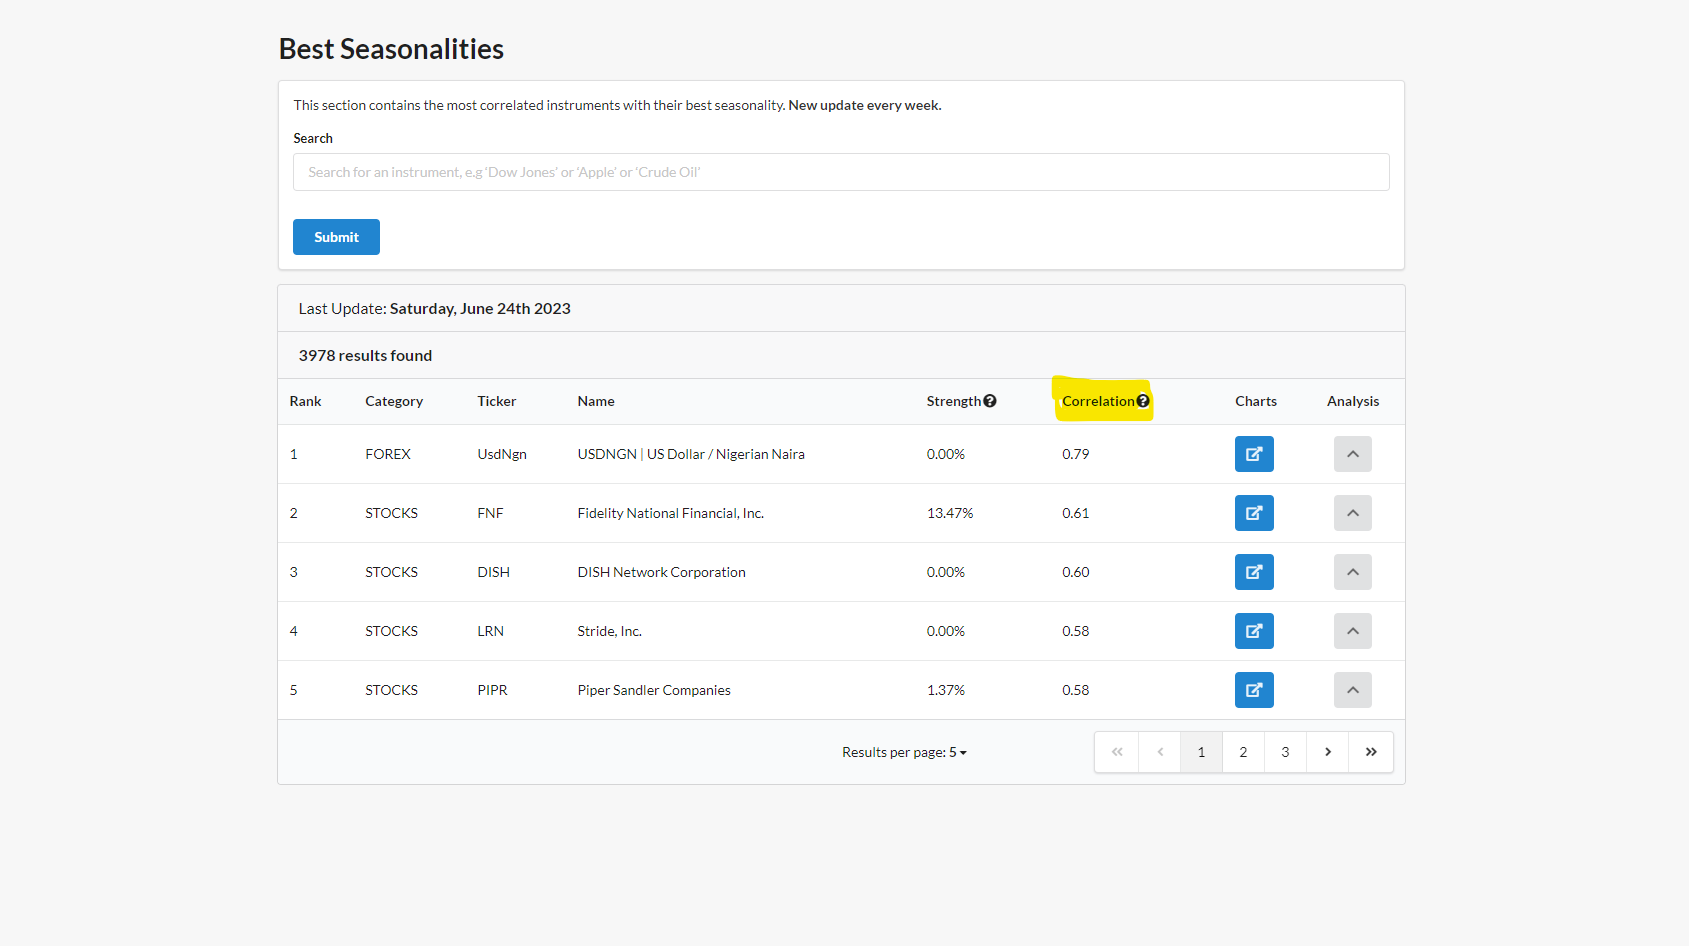
- has Tickers sorted by Correlation, computed between last 12 months returns and Seasonality.
- has Strength column, that is taken from the Algorithmic Rank page. In few words, it is a synthetic valuation, from 0 to 1, of the expected return of the Ticker from now untill the end of the current month given by Seasonal Statistics and current month return.
Watching to the screenshots below.
In the Ranking table:
- the 1st Ticker has a Correlation of 0.79, and Strength 0
- the 2nd Ticker has a Correlation of 0.41, and Strength 13%
In the Chart there are 2 lines:
* Red is the Best Seasonality
* Blue is the Ticker
Practical notes about the Strength, in this example:
- the Last Update is Saturday, June 24th 2023, that is near to the end of the current month
- so Strength is not so important, it matters less than it did in the first few days of the month, because there are few days left in this month for the Ticker to express performance.
How Best Seasonality is computed
More than one Seasonality
A Seasonality is the cumulative average return computed from year X to year Y. So, by changing the starting and ending years it is possible to build many Seasonalities .
For example, if the current year is 2023, the Seasonality of the last:
- 5 years: is computed with historical data from 2018 to 2022
- 10 years: is computed with historical data from 2013 to 2022
- Entire History: is computed with historical data from the first year available to 2022
The Algorithm
For each Ticker the Algorithm:
- take the last 12 months of the weekly returns of the Ticker
- compute dozens of Seasonalities, by changing the starting year and mantaining fixed the ending year (to 'current year - 1'), and for each Seasonality computes the linear Correlation with Ticker returns.
- choose the Best Seasonality as the Seasonality with the higher Correlation