Intraday Charts page
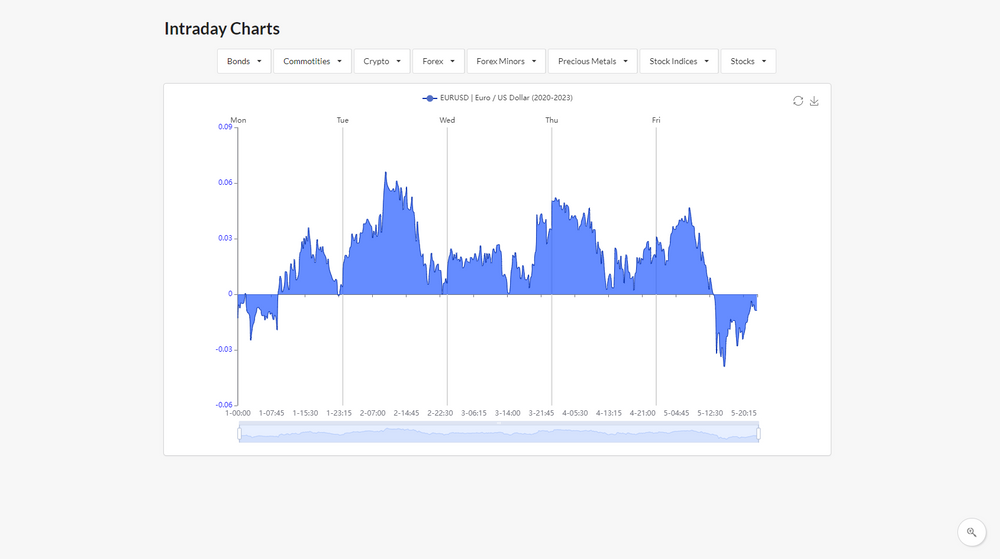
Intraday charts are computed over 15 minutes data, and show the average return of a Ticker, as a cumulative sum of the average return of each 15 minute timespan.
Plot Intraday Chart
Select a Ticker from the drop-down Menu to plot an Intraday Chart.
In the chart:
- Y-axis
- represents the percentage change of the price
- For example, a value of 0.06 = 0.06% of variation
- By default, the chart is divided in Weekdays. It's possible to change this feature and other ones.
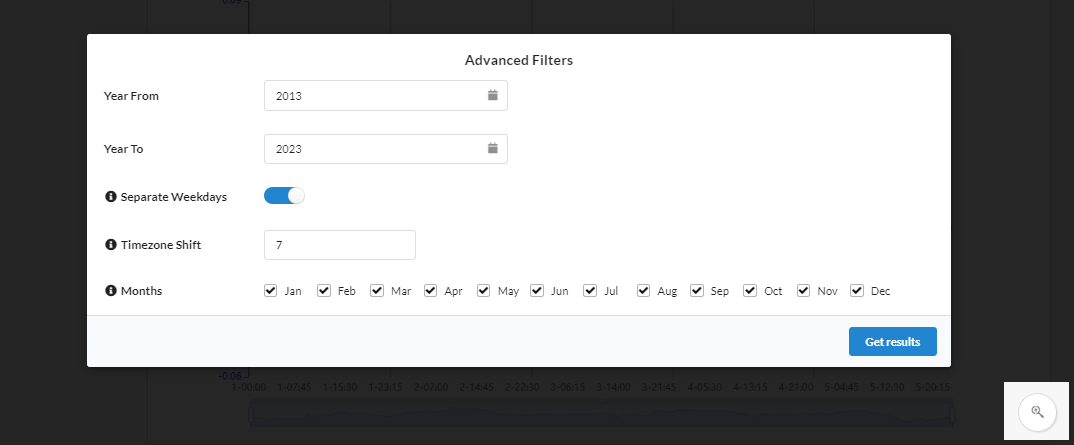
Advanced Filters
After the chart has been drawn, by clicking the lens icon in the bottom-right corner of the page, a window with Advanced Filters will be opened.
It has the following settings:
- Year From and Year To
- the years of historical data to be considered in the computation
- Separate Weekdays
- By default selected, so the in the charts you see returns separated for each Weekday
- If deselected, the returns of all the Weekdays will be aggregated
- Timezone shift
- Data is collected in Chicago Timezone (GMT -6/-5)
- TimeZone Shift +7 brings returns in Amsterdam/Berlin//Rome TimeZone (GMT +1/+2)
- Months
- the months of historical data to be considered in the computation
It is possible to explore the platform for Free, and decide later whether to become a Premium member, to unlock full data of Intraday Charts, and more.
ForecastCycles
Get the latest trends on the market