Historical Similarity page
Mark Twain once said: "History doesn't repeats itself exactly, but it does often rhyme."
Introduction
It may happen that a financial instrument, but also nature or a human life, repeats in the present, in a similar way, a path that has already taken place in the past.
How it is calculated
The algorithm of Historical Similarity:
- finds periods in history in which price has moved similarly to the last 2 and 4 years.
- scans all the 2- and 4-year time frames in the historical data, and chooses the most similar ones through the linear correlation coefficient.
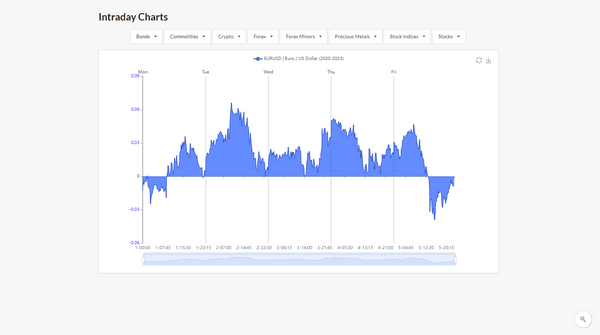
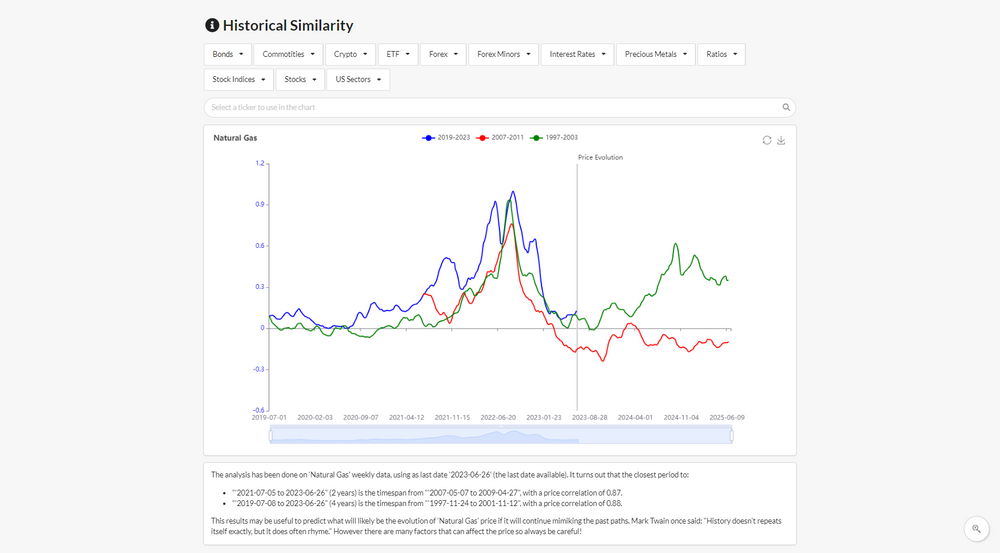
Plot Historical Similarity Chart
The Historical Similarity analysis is available for all Tickers in database that have at least 10 years of historical data available.
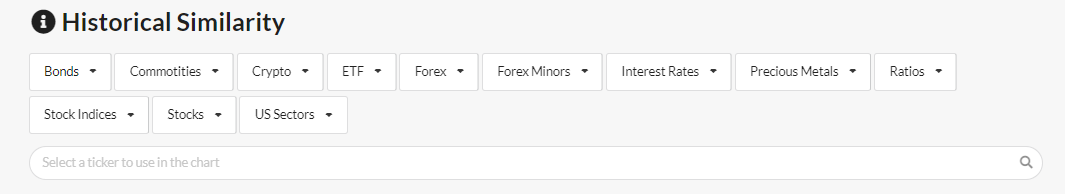
To plot a chart it's possible to:
- select a Ticker from the drop-down Menu, or
- search and select a Ticker from the search-box
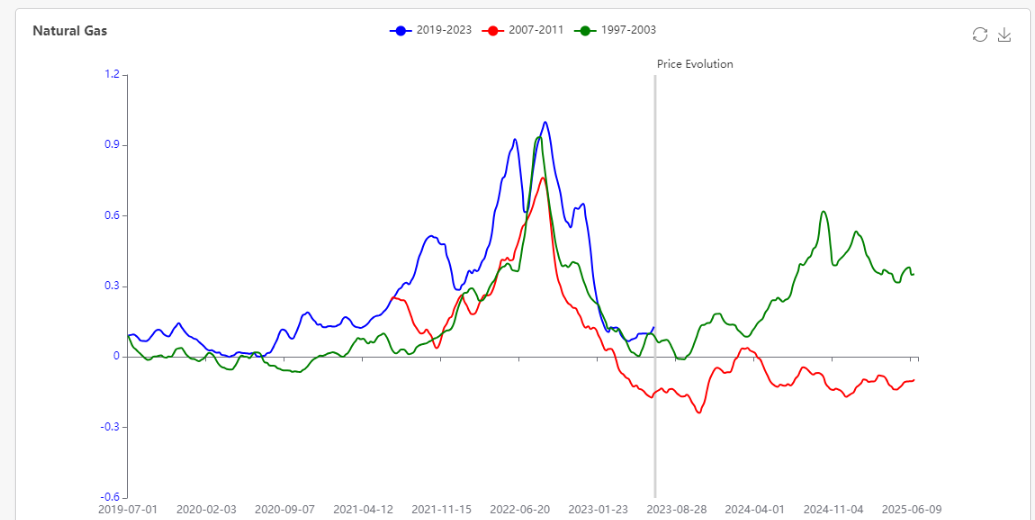
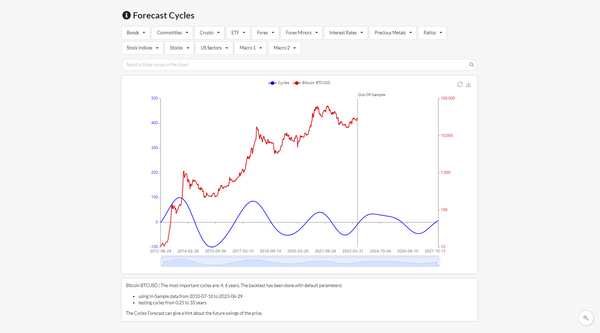
The Chart has 3 lines that represent the price movement of the Ticker in 3 different timespans. More specifically:
- Blue: the last 4 years
- Red: the most similar period to the last 2 years
- Green: the most similar period to the last 4 years
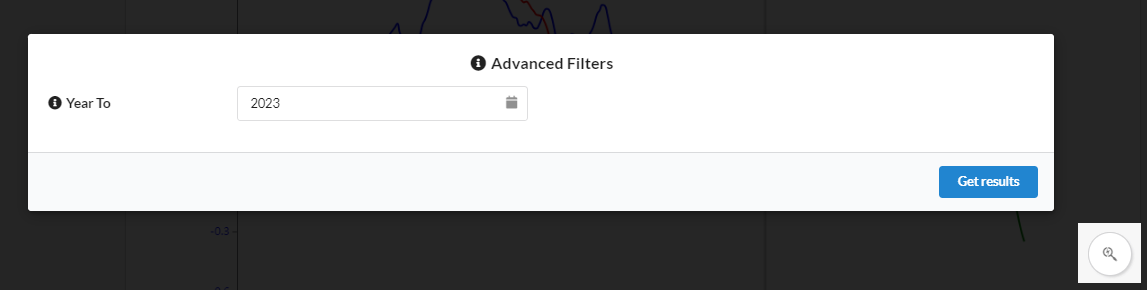
Advanced Filters
After the chart has been drawn, by clicking the lens icon in the bottom-right corner of the page, a window with Advanced Filters will be opened.
It has the following setting:
- Year To
- It is the starting year of the 'Price Evolution', the vertical line in the Chart.
- The default value is the last available date in the historical data.
- You can also do a test in the past, for example:
- if 'Year To'=2020
- ==> it will be searched in history the most related periods to 2018-2020 (last 2 years), and 2016-2020 (last 4 years).
The Historical Similarity page is available in all its functionality to both Free and Premium Users.
It is possible to explore the all the other platform sections for Free, and decide later whether to become a Premium member, to unlock full functionalities.