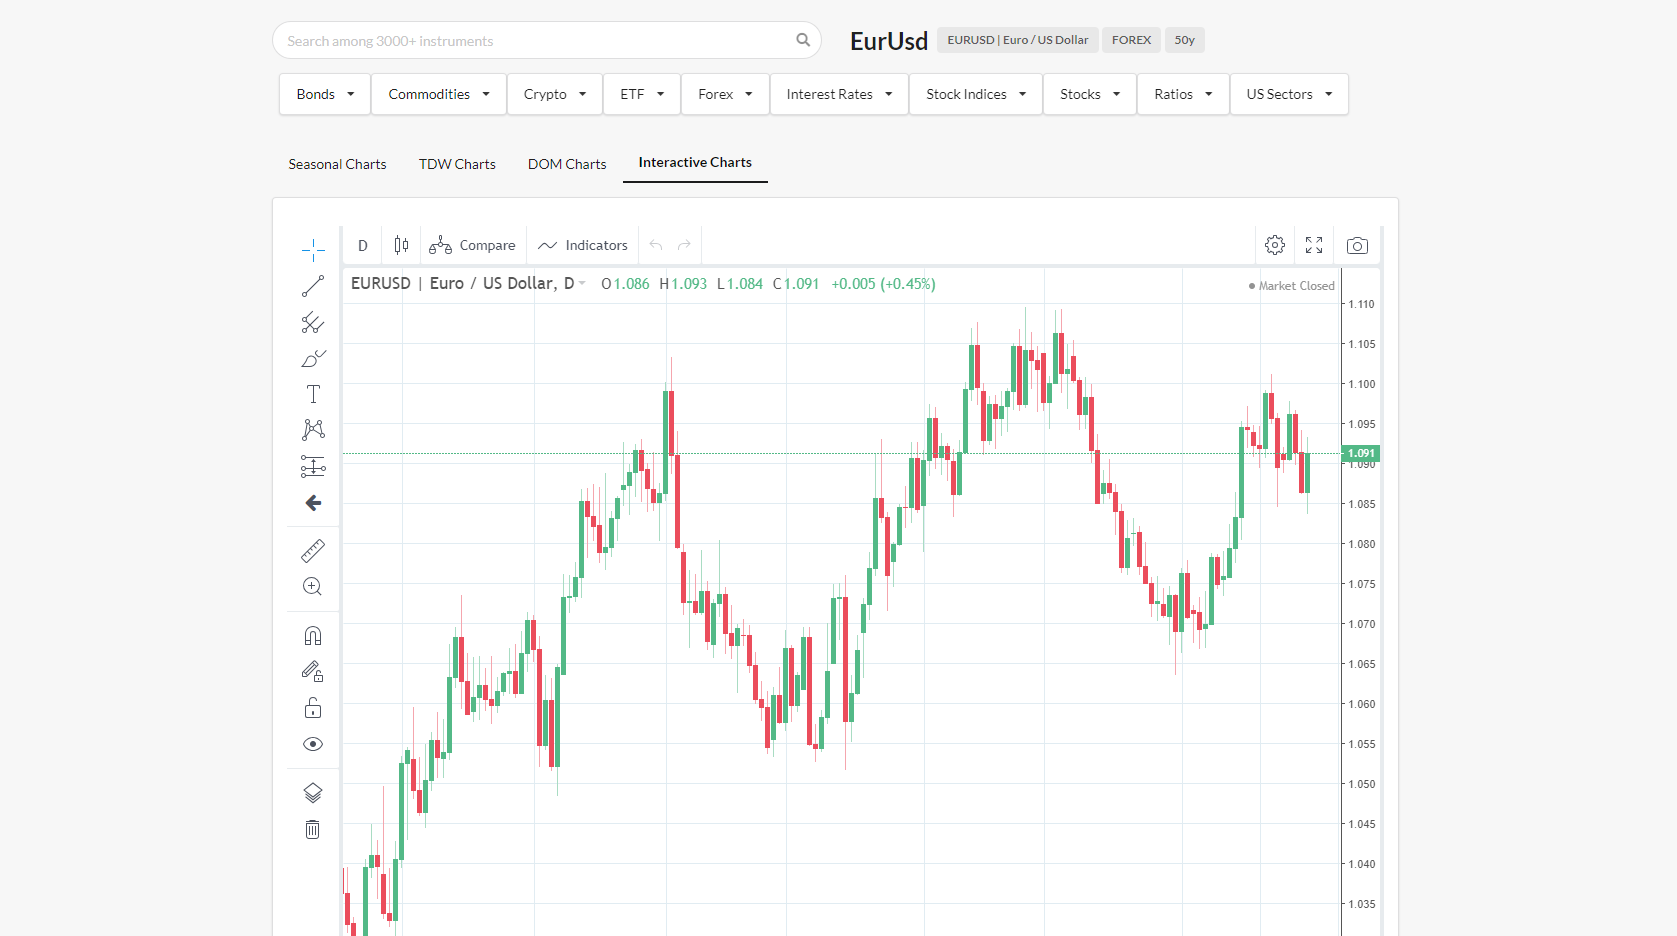
Interactive Charts tab
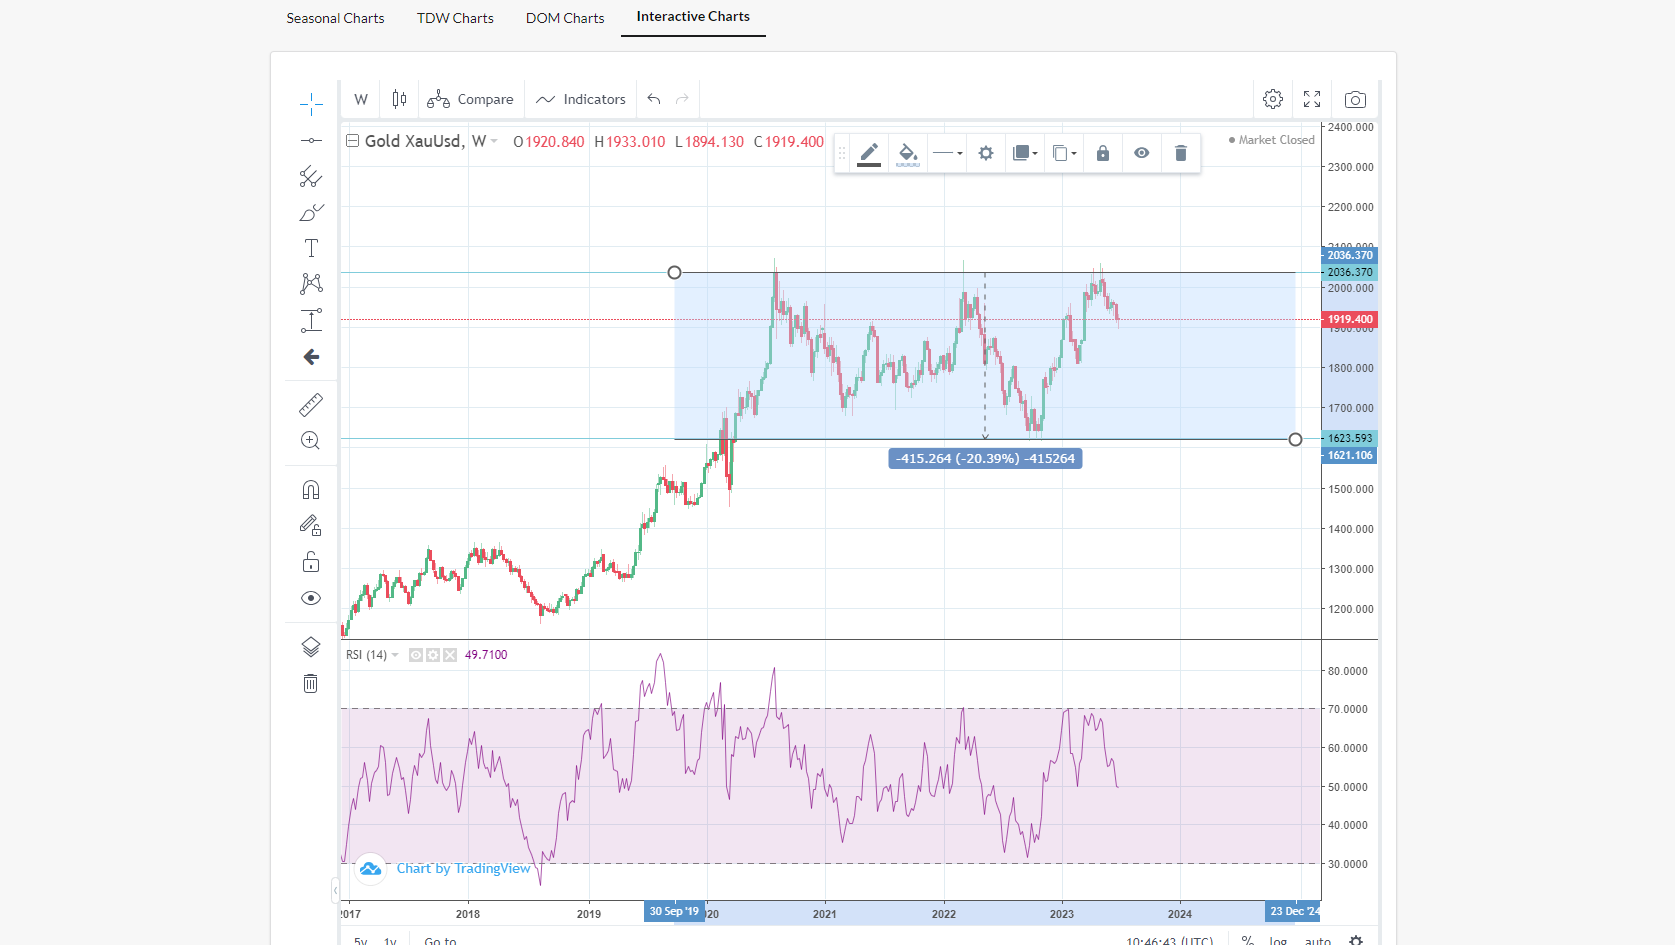
Interactive Charts, sponsored by TradingView, contains the chart of the Ticker using ForecastCycles daily data.
In the chart is possible to:
- do technical analysis
- draw lines
- draw indicators
- change timeframe, to a one greater than 1 Day
- compare Tickers
- etc
ForecastCycles
Get the latest trends on the market