Seasonal Charts page
Seasonal Charts page has many Charts to analyze Seasonality in different Months, Weekdays, and Days of Month.
This is the very first page developed, the first fruit of ForecastCycles Platform.
Plot Seasonal Charts
The Seasonal charts are available for all Tickers in the database.
To plot a chart it's possible to:
- search and select a Ticker from the Search-box, or
- select a Ticker from the drop-down Menu

Charts Explanation
When a Ticker has been selected, 4 Tabs will appear:
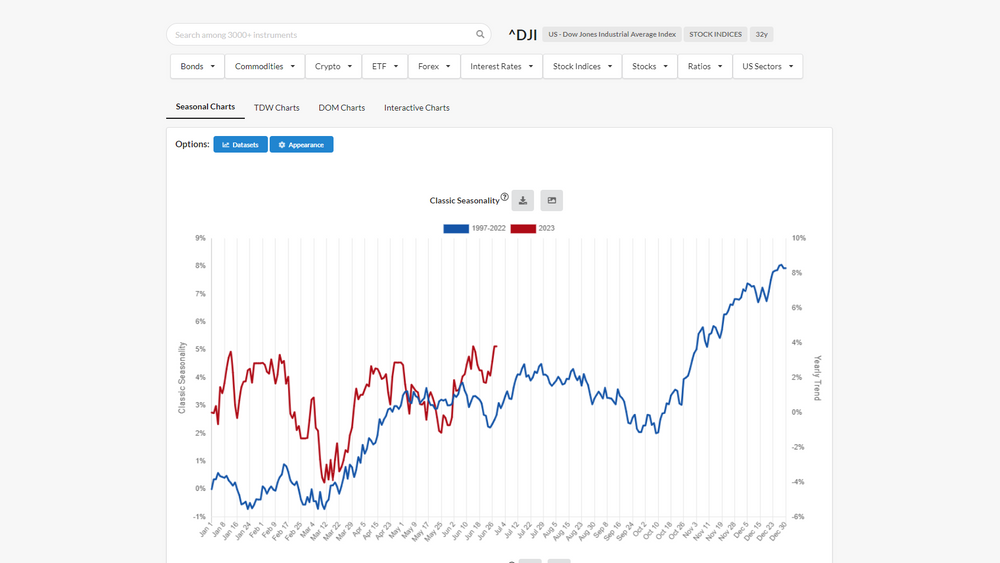
- Seasonal Charts tab
is composed by 6 charts that analyze seasonal metrics such as average Return, average Volatility, Winning percentage for all the 12 months. - TDW Charts tab
the returns of the Ticker in the different Trading Days of the Week. - DOM Charts tab
the returns of the Ticker in the different Days of Month. - Interactive Charts tab
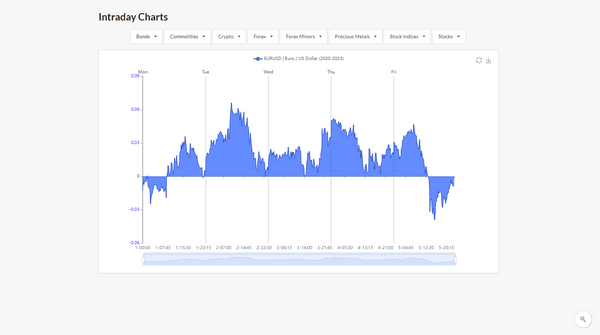
the chart of the Ticker using ForecastCycles daily data.
ForecastCycles
Get the latest trends on the market