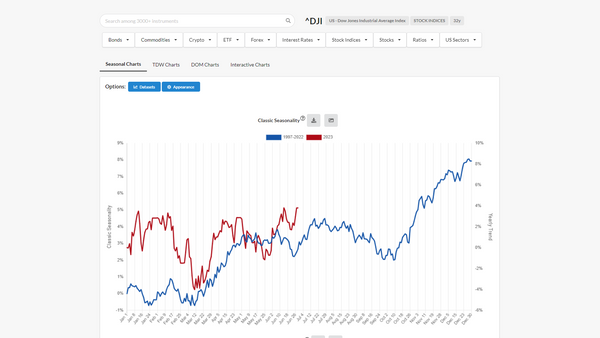
DOM Charts tab
DOM Charts tab contains the returns of the Ticker in the different Days of Month.
DOM Charts
DOM Charts tab has 2 types of Charts.
In both charts, the backtest is done:
- in the entire historical data available of the Ticker
- in simple capitalization, by investing the same amount of money each trade
- by buying the Ticker at the opening price of the Day Of Month,
- and closing the long position at the closing price of the same DOM.
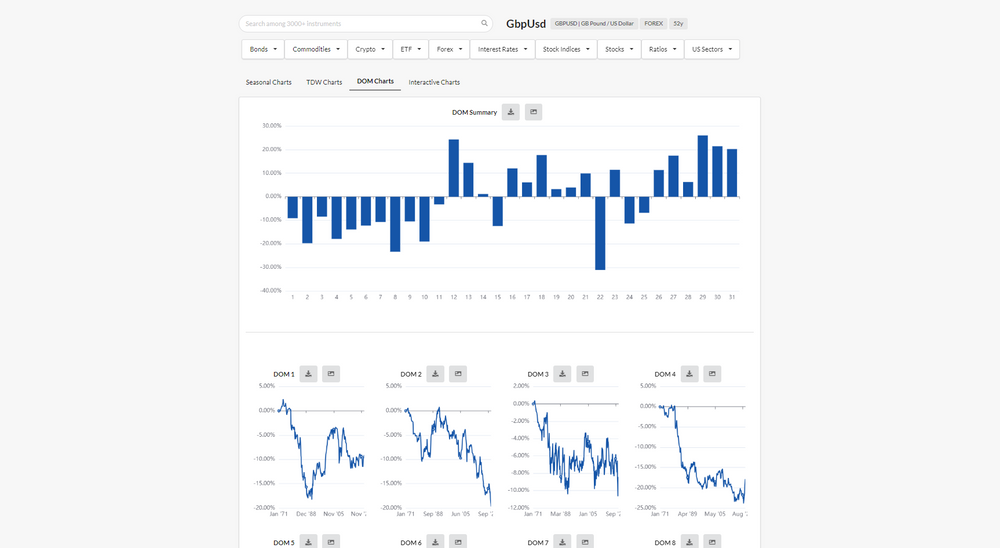
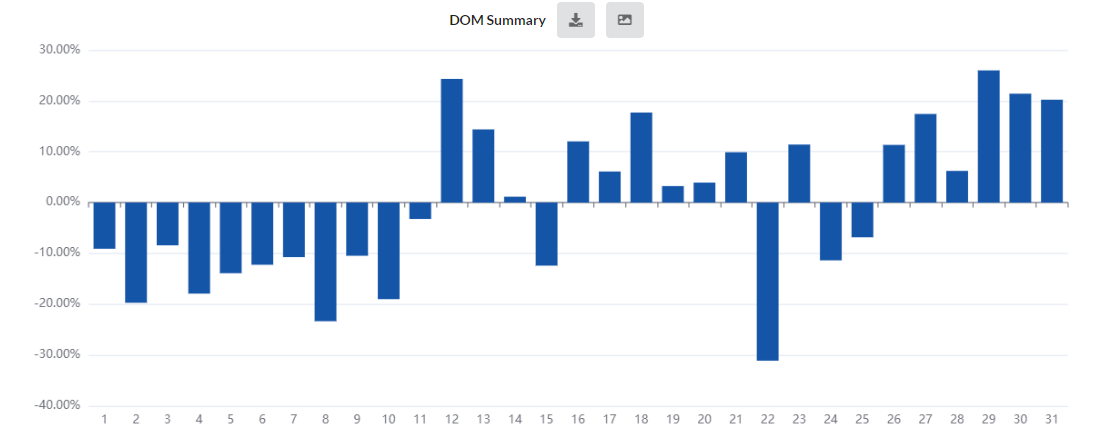
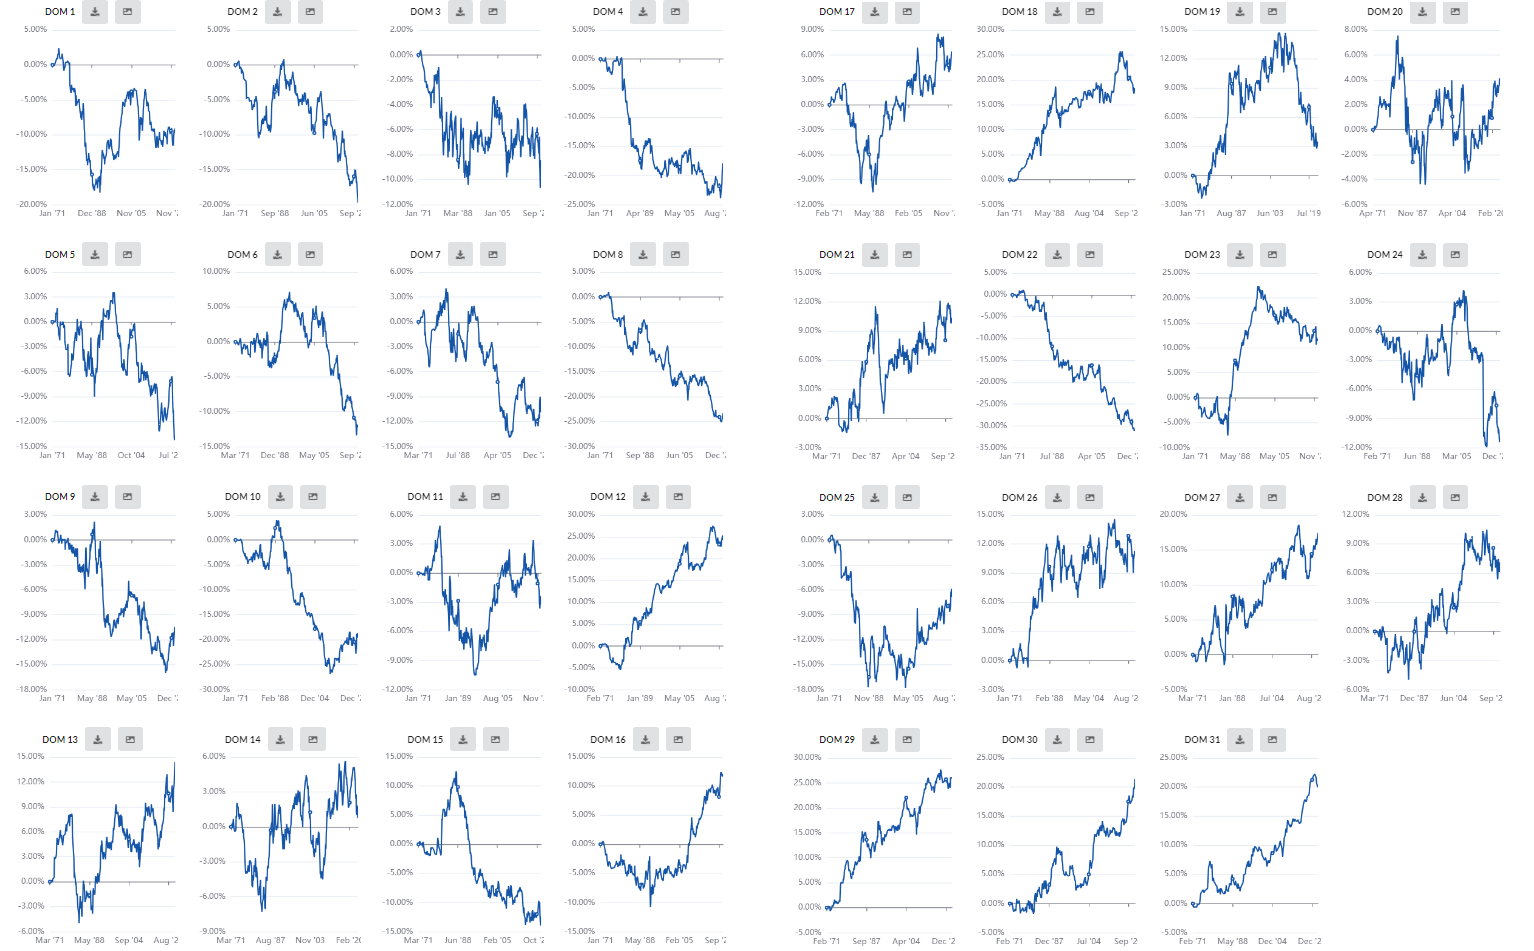
DOM Summary chart
In the top of the page, there is the DOM Summary chart. It contains the final return of each Day Of Month.
For example, GBPUSD DOM Summary chart shows that the Ticker:
- use to decline in the first DOMs
- use to rise in the last DOMs
n°31 DOM charts
Below the DOM Summary chart, there are n°31 DOM charts, showing the evolution of the capital of a long strategy in each DOM.
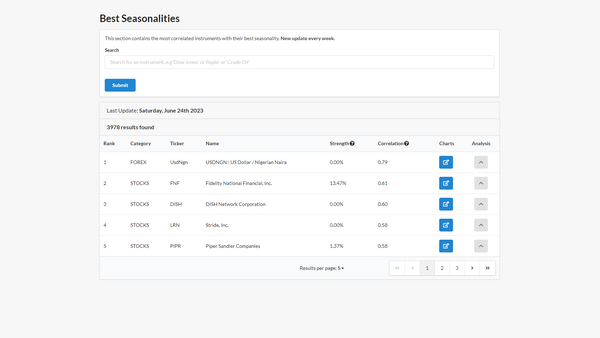
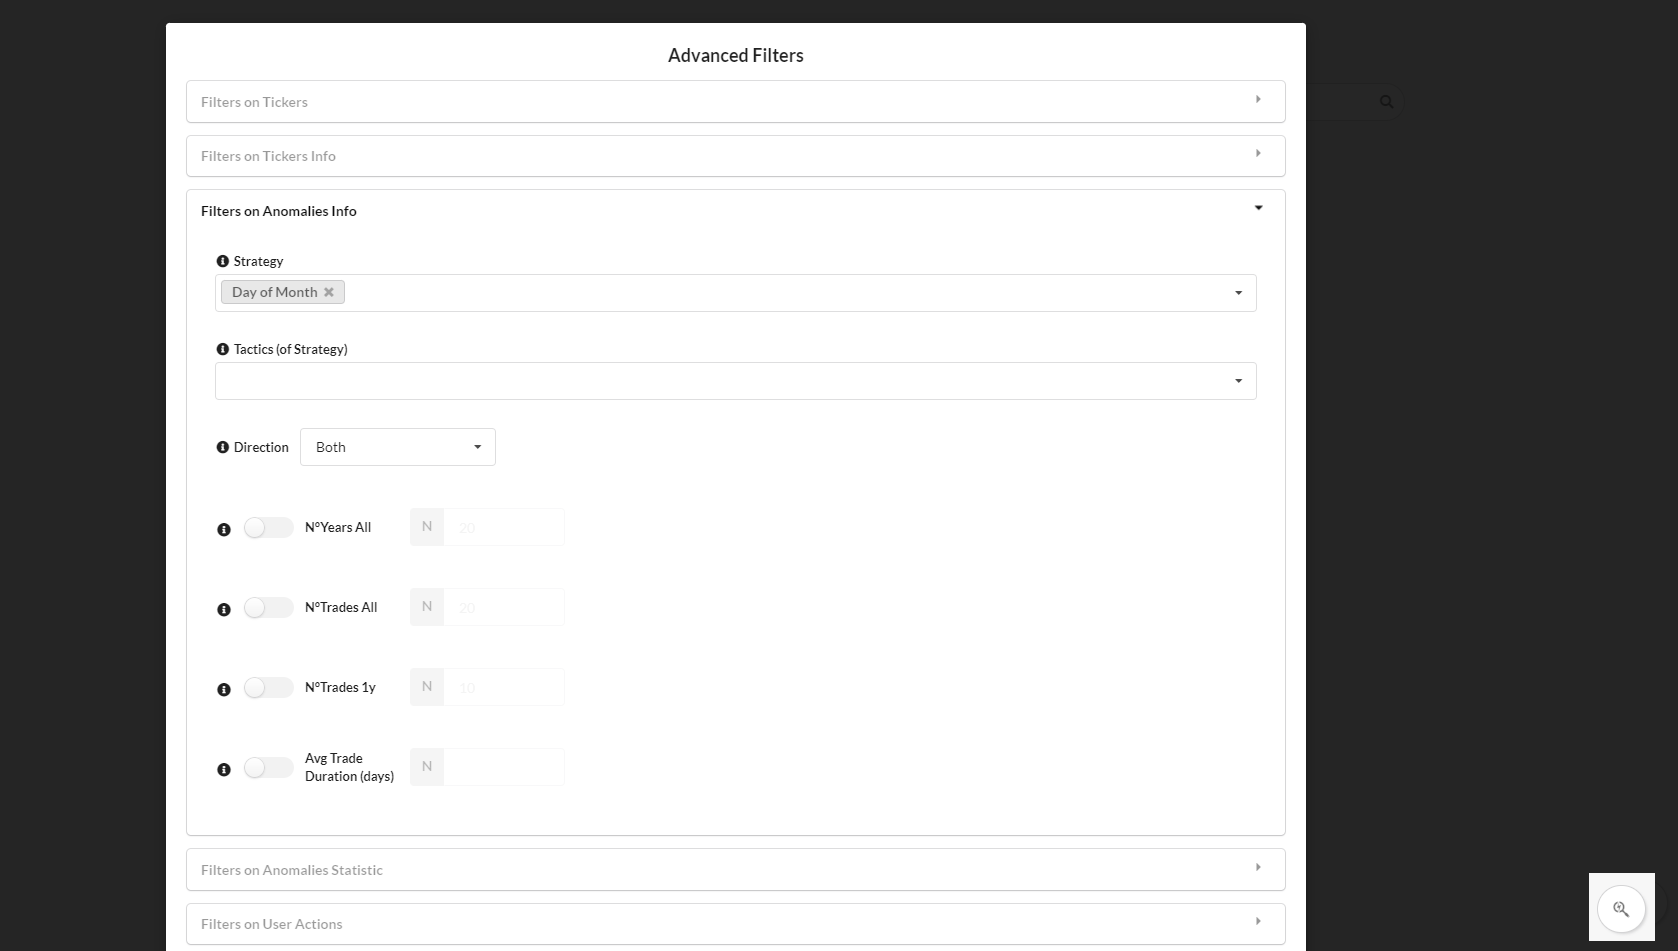
DOM Strategies Screener
It is possible to use the Screener to evaluate the backtests of the strongest DOM Strategies among all the Tickers in the Anomalies Ranking page:
- a video tutorial is available in this Youtube Video
- the description of the page is available in this article.
ForecastCycles
Get the latest trends on the market