The impact of Seasonality in financial markets
Seasonality is observed in charts as a repetitive behavior of a financial instrument, usually within a calendar year. There can be many reasons why seasonality is present in financial markets, often difficult to grasp, and these conditions can also be different for each market.
What certainly happens and is the cause of seasonality is an irregularity of the inflows and outflows of money in a market, compared to an average period.
Nature is Cyclical
Many of the things that exist in nature are cyclical, starting from the universe up to man. We are a by-product of nature and the universe, humans are cyclical as we are born, grow, age, die, and reborn as children.
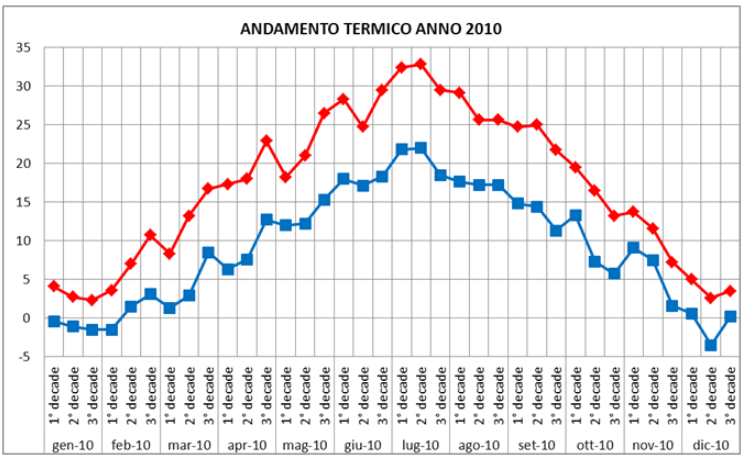
Moving outside the financial markets we can see seasonal phenomena in nature and their effect on measurable data, such as:
- the seasons of the year influencing temperatures,
- the lunar cycle influencing tides and optimal planting times.
So, since financial markets are a by-product of humans, they must have a cyclical component too.
Seasonality of S&P 500
Have you ever heard the saying Sell in May and go away? Although it is not a complete saying, because it does not say when to buy but only when to sell, it hides a truth.
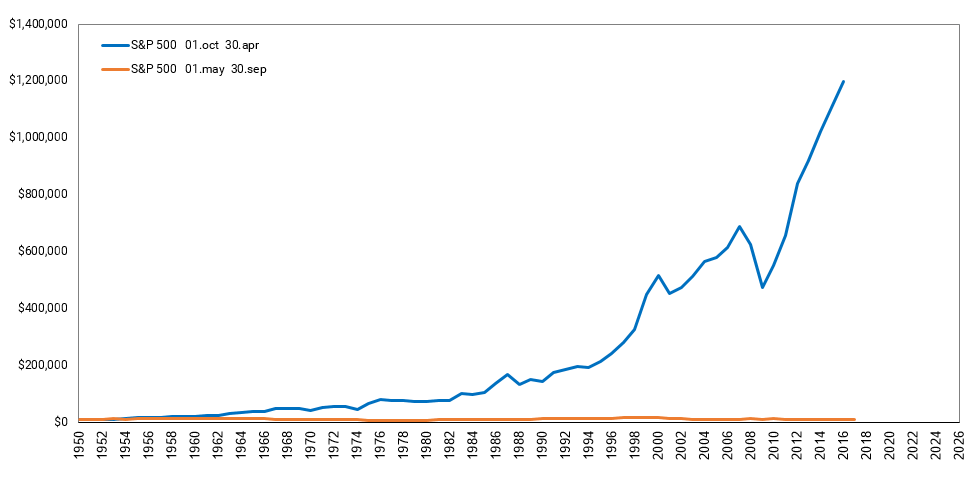
Let's analyze it with numbers, dividing the calendar year into 2 parts:
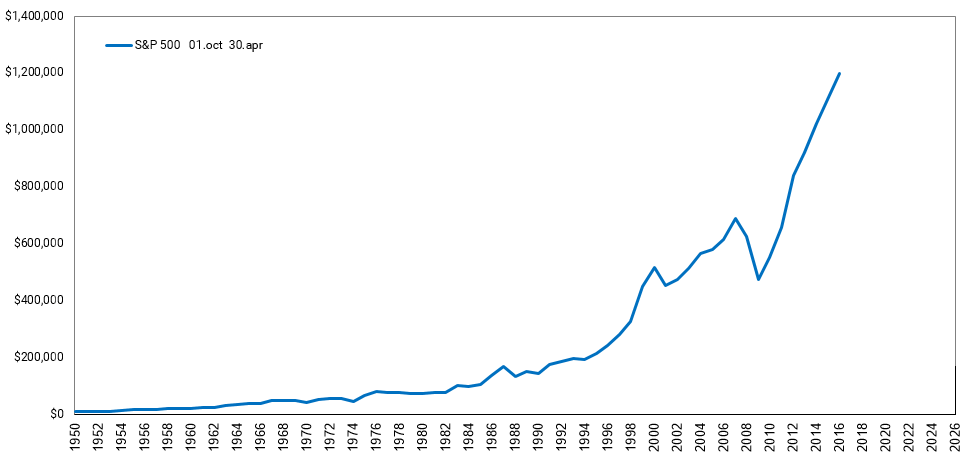
- the 1st part runs from the beginning of October to the end of April, and is the Halloween effect
- Average yearly return is 8.80%, apart from some drawdowns like that of 2008, the equity line shows constant capital growth.
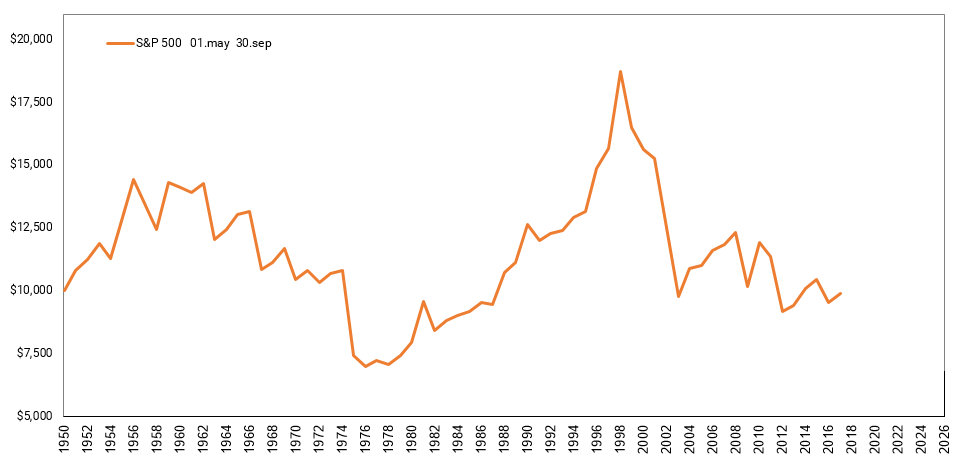
- the 2nd part runs from the beginning of May to the end of September
- Average yearly return is 0.39%, the equity line shows an alternating rise and fall, and a gain close to zero.
The results are striking: the S&P 500 earnings are made almost exclusively during the Halloween effect period.
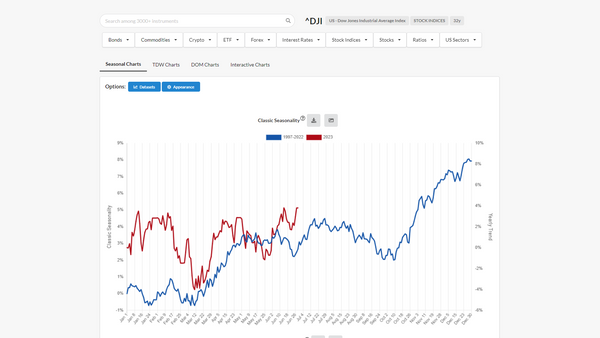
In fact, on ForecastCycles Platfotm, looking at the average month-by-month return of the S&P 500, the Monthly Average Performance chart, makes the Halloween effect clear.
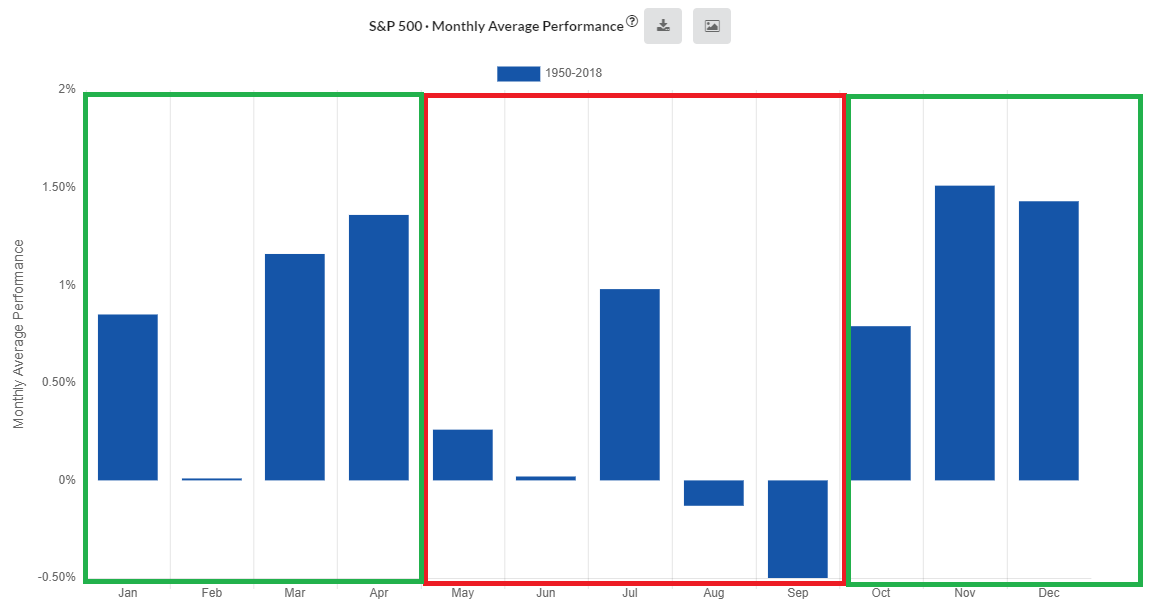
The months of the 1st part, the Halloween effect, (green rectangles) are much better in terms of performance than the months of the 2nd part (red rectangle).
There are two exceptions:
- in the 1st part, February is a neutral month, not as good as the others
- in the 2nd part, July is a positive month
The idea of abandoning stocks in May each year has its origins in the UK, where the privileged class left London for their country estates for the summer, largely ignoring their investment portfolios, to then come back in September.
In fact, in contrast, the summer months are those in which Bond prices record the best performances. The summer period has generally been associated with a holiday period, in which investors prefer to lower their risk level, shifting their capital towards lower risk level investments such as government bonds.
Seasonality of Microsoft
Below, the average returns of the Microsoft share broken down by month.
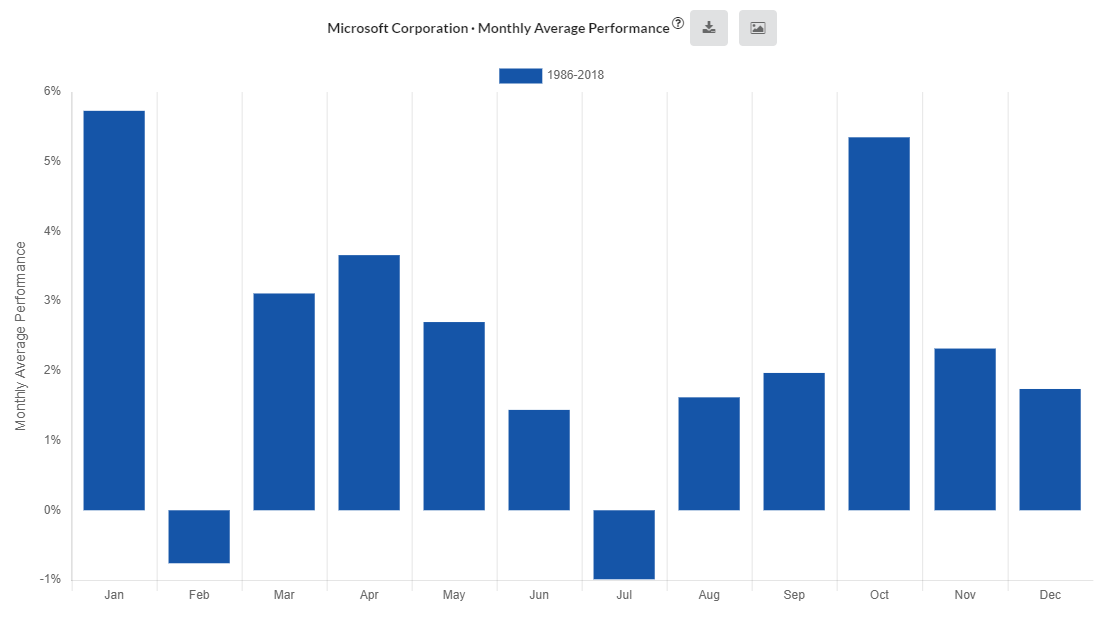
The best months for Microsoft are similar but not the same as the S&P index. For example:
- the Halloween Effect is present, but is milder since there is a smaller difference between the 1st and 2nd period.
- July, one of the best months of the S&P, is negative.
Conclusions
Seasonality is an analysis that can be useful for building trading strategies, best when combined with fundamental analysis. A trading legend, Larry Williams, uses seasonality a lot in his automated trading systems, and for some strategies, seasonal evidences are the main component.
The Halloween Effect:
- is one of the clearest evidence of the presence of seasonality.
- in S&P 500 can be called "an Anomaly", since there not should be a period of time that offers returns significantly different from another.
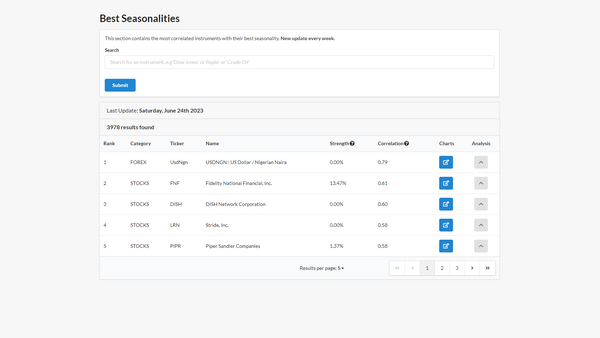
- In ForecastCycles Platform there is the Screener of Seasonal Anomalies, which includes the Halloween effect evaluated for all Tickers:
- you find a detailed description of the Screener of Anomalies in this article.
- and the description of Halloween Effect Strategy in this article.