[MAIN] ForecastCycles World
To read the article in a different language follow this guide
Introduction
Forecastcycles provides information and tools to increase your capital both in the short and long term.
ForecastCycles Platform Sections
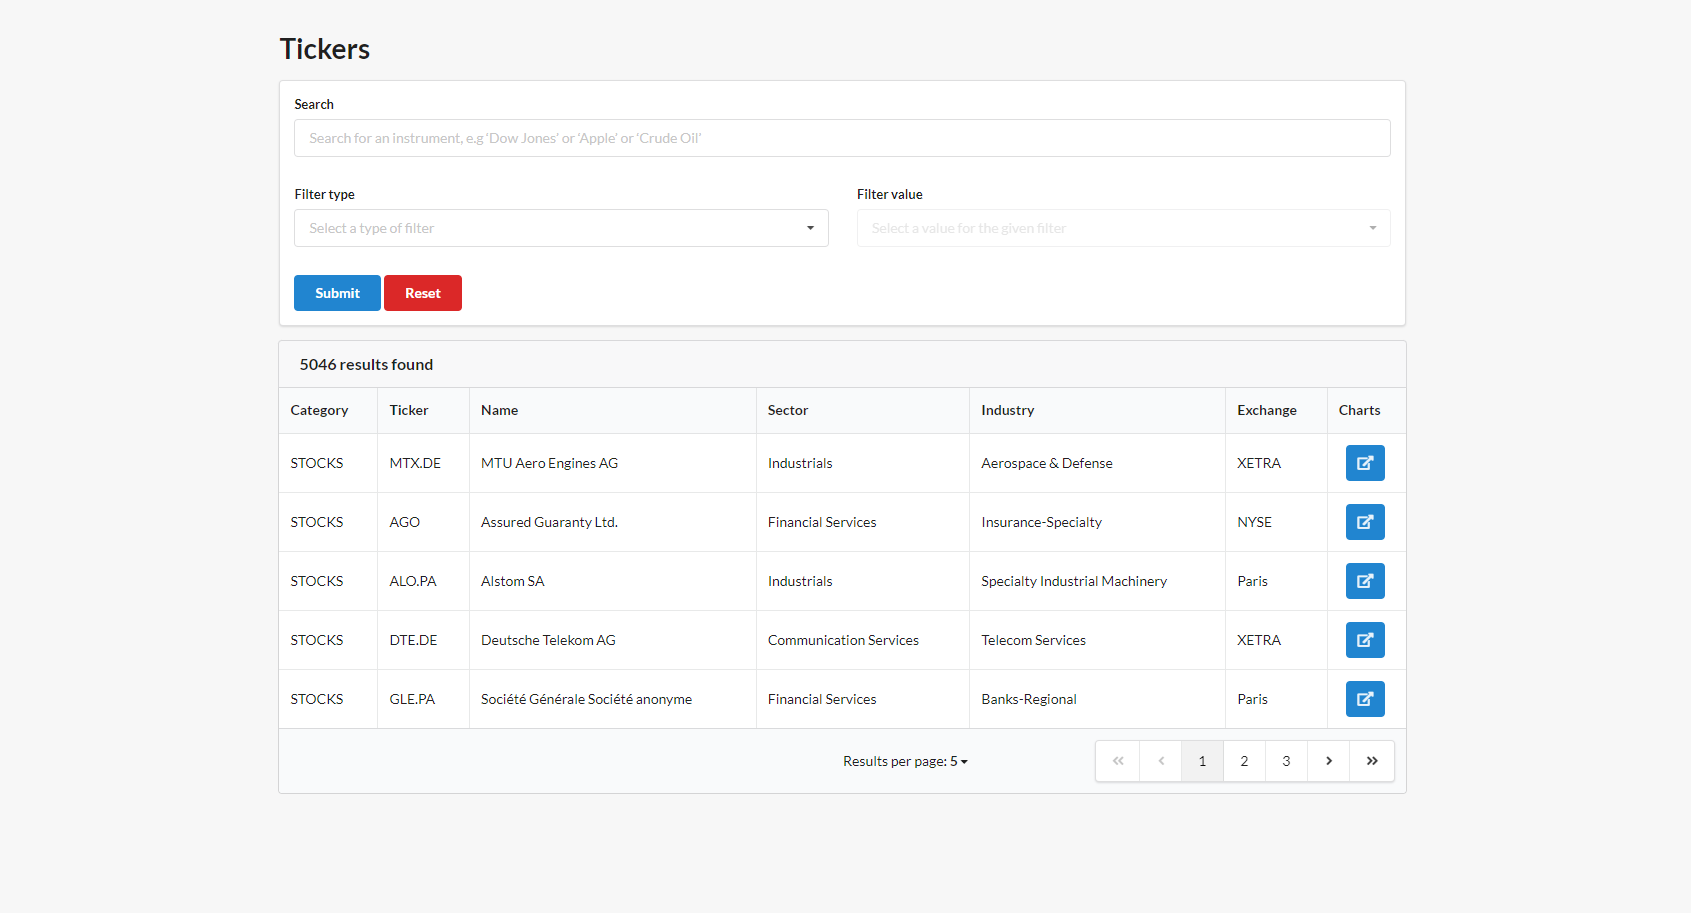
In the Tickers page are listed the financial instruments in the database.
ForecastCycles Platform is composed by 7 Sections that gives indications and tools to exploit opportunities in different time-horizons.
LONG TERM
-
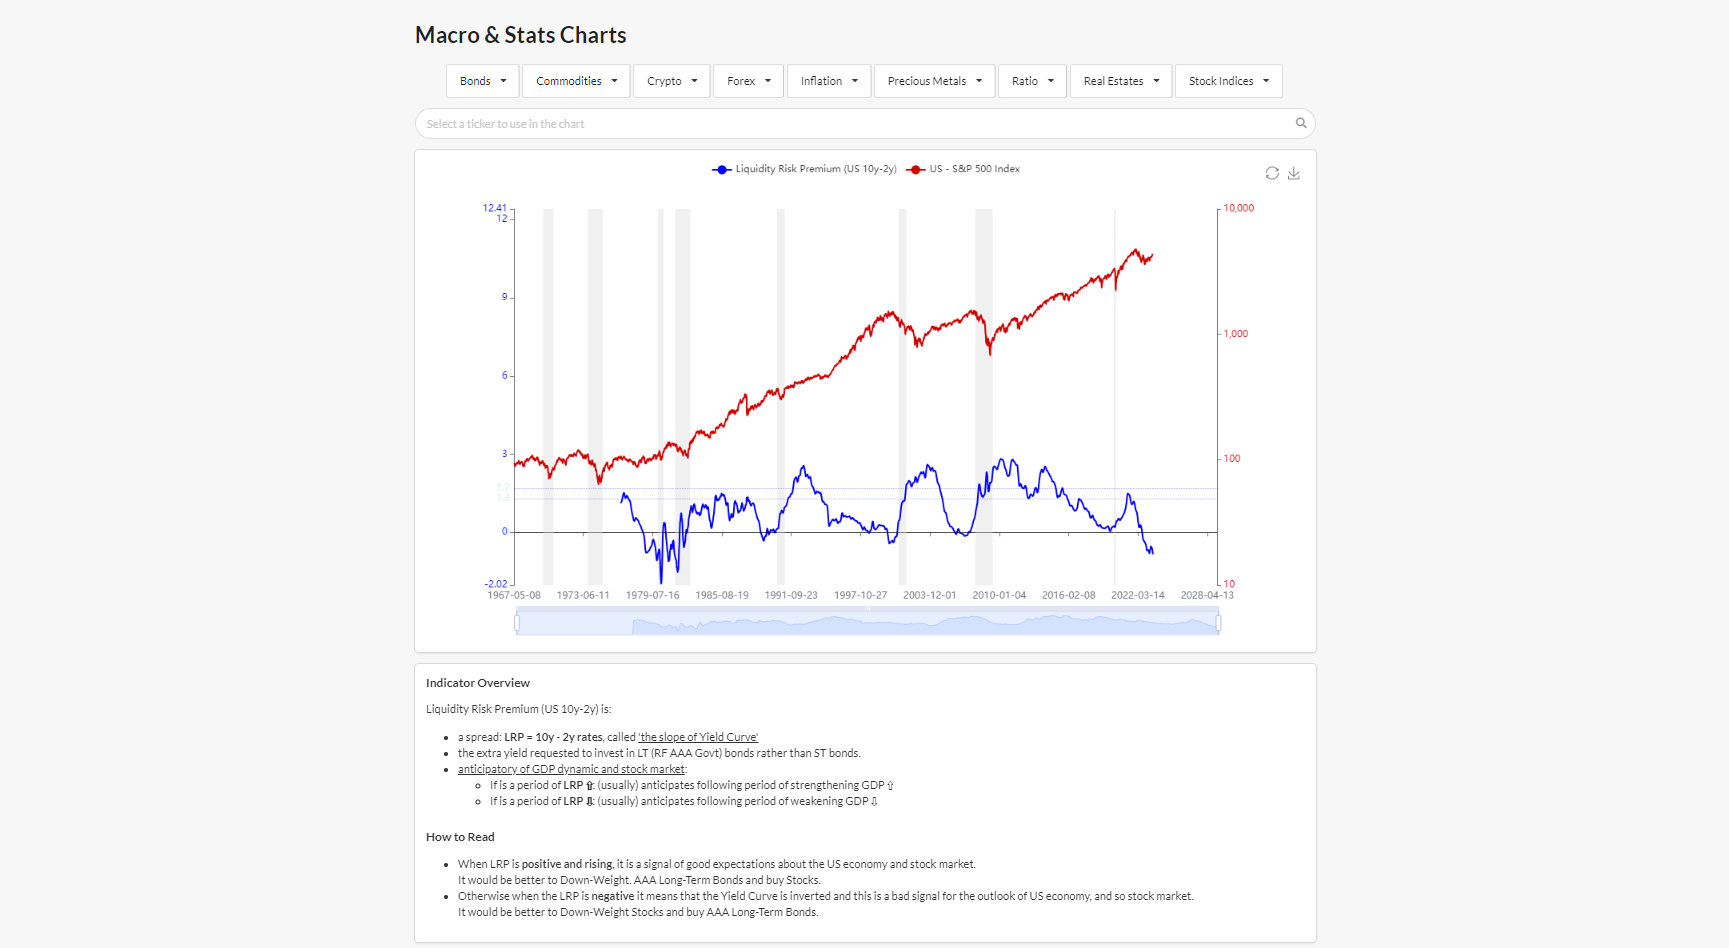
- to zoom-out the behavior of the most important assets, correlating it to indicators
- to identify the under/over valuation of an asset class
-
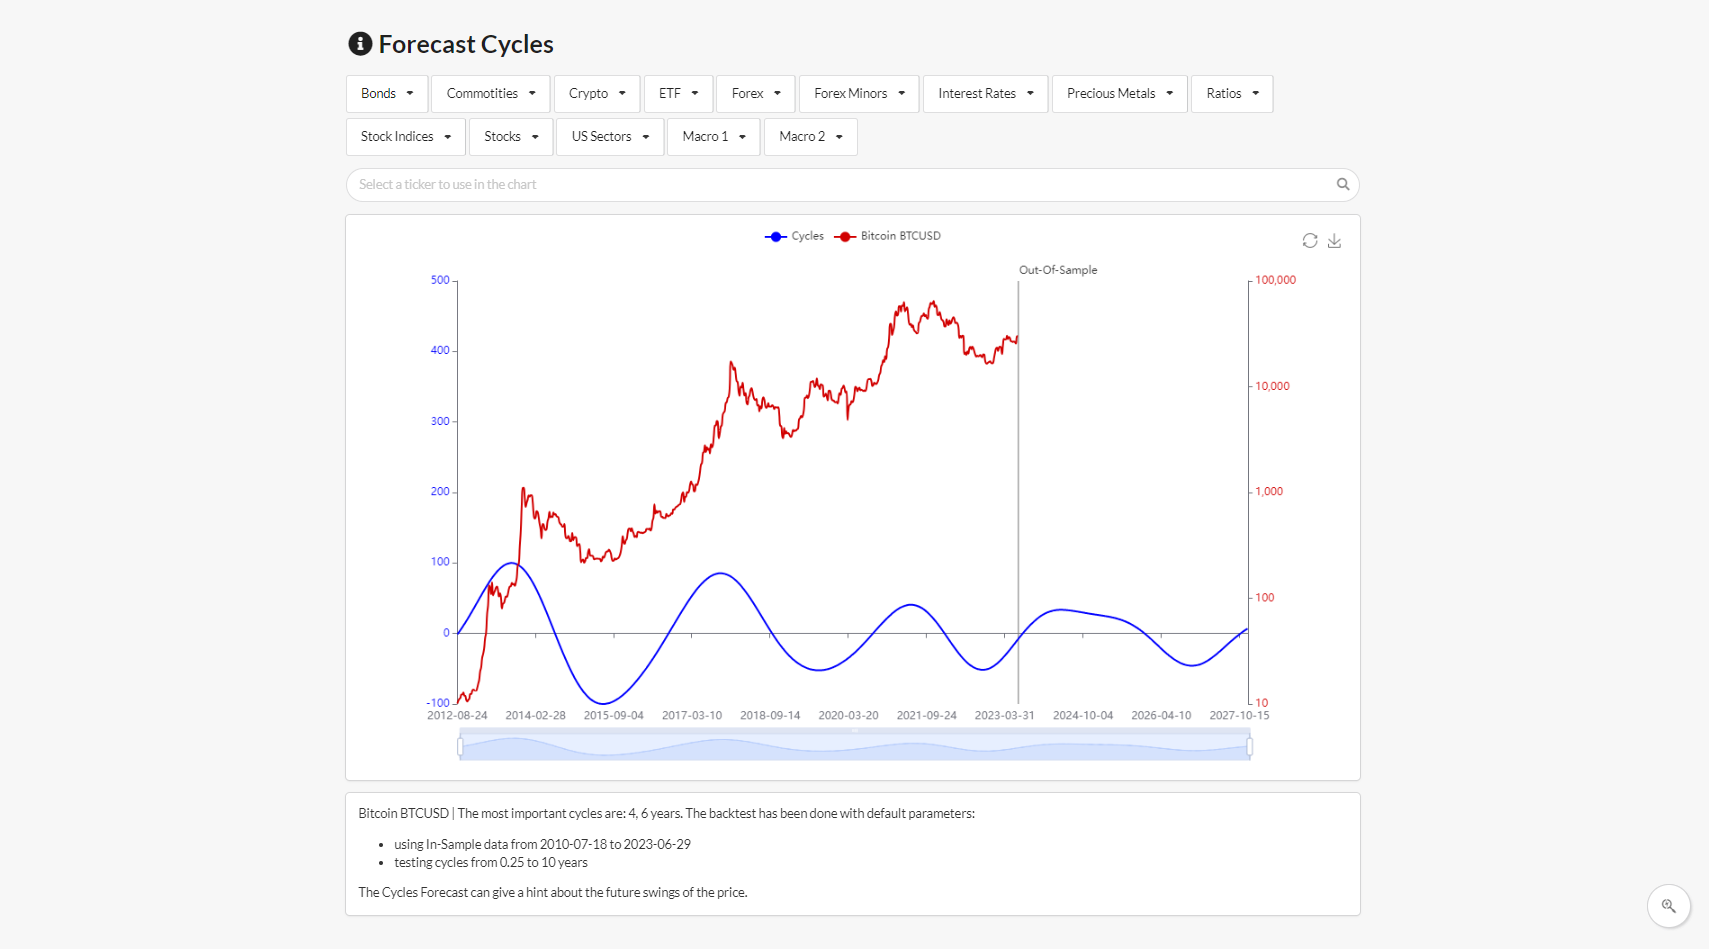
- to find out how well cycles are modeling the price
- to see future projection of the cycles, useful if a market exhibit a strong cycle influence
MID TERM
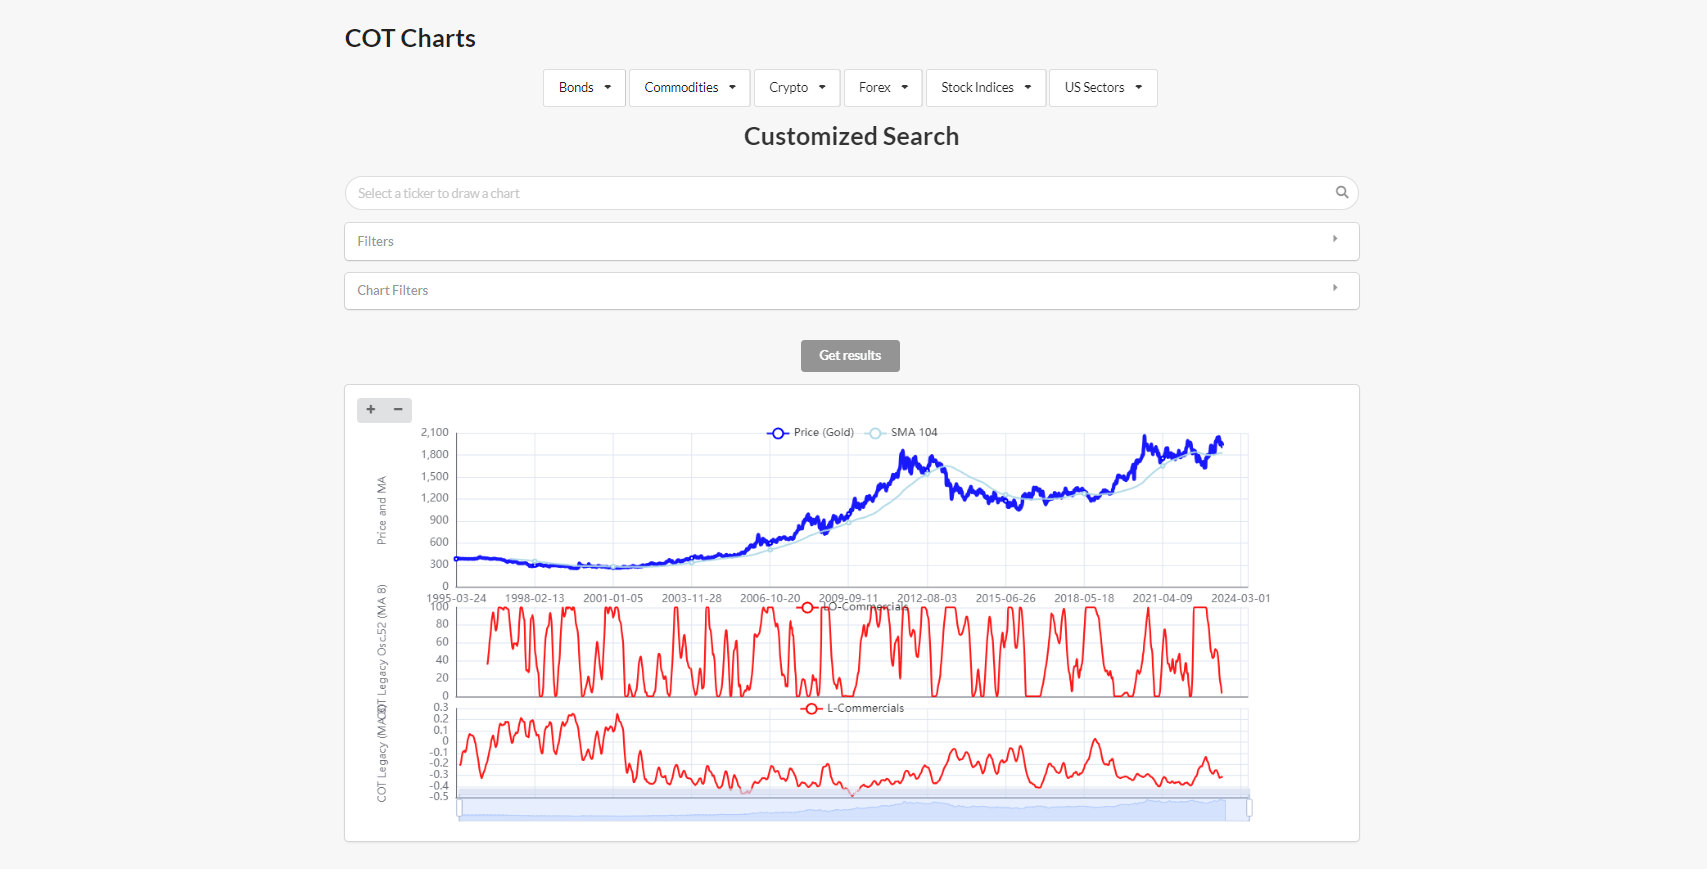
- COT charts
- to know the Net-positions of the Whales (banks, funds, professional investors) in 50 markets
- to take decision knowing how smart-money is moving
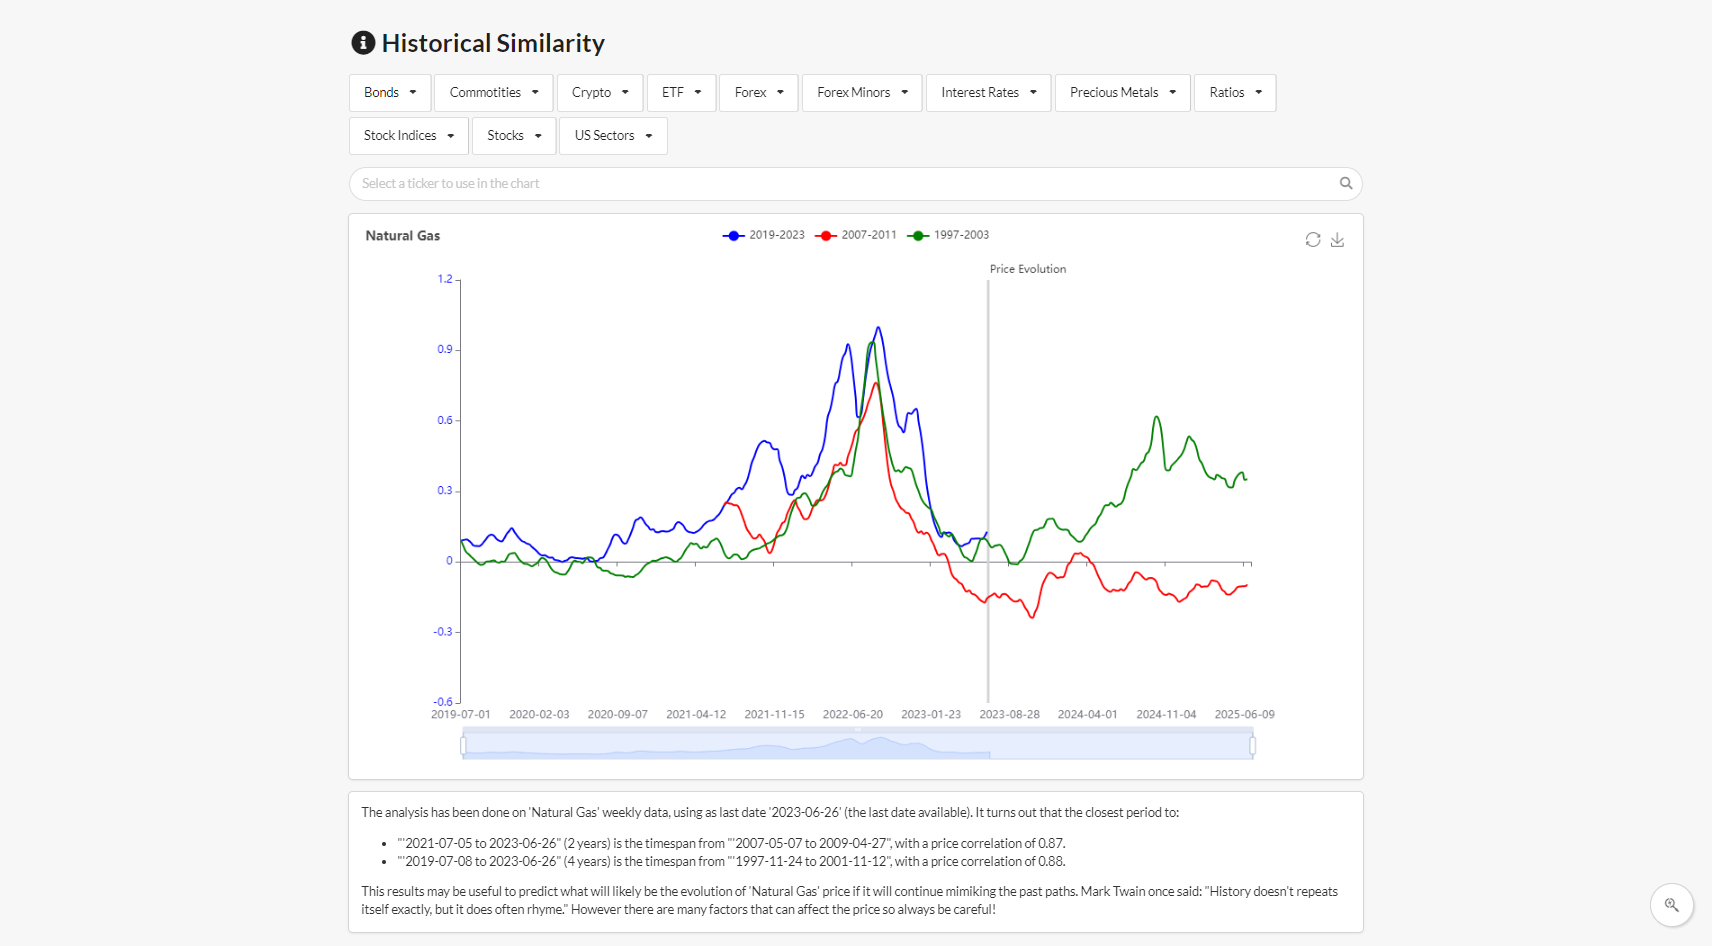
- Historical Similarity charts
- to find whether a market is following a past price dynamic
- to see the future projection of the most correlated dynamics
SHORT TERM
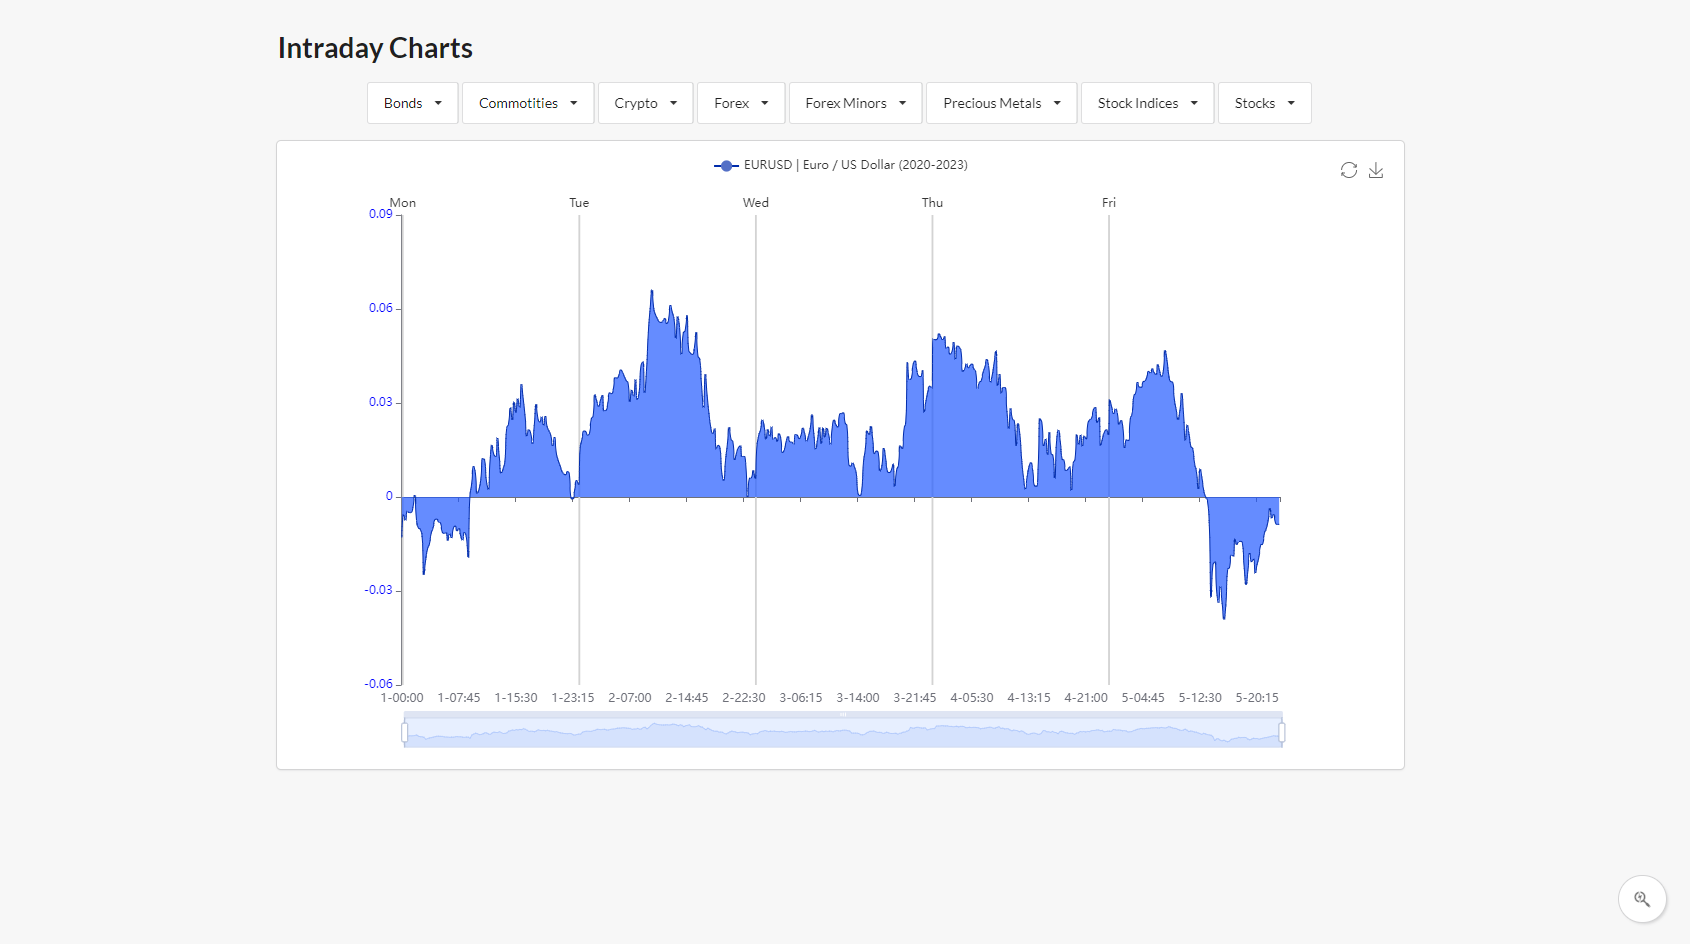
- Intraday charts
- to analyze the average price movement in a trading day
- to visualize the bullish and bearish trading hours
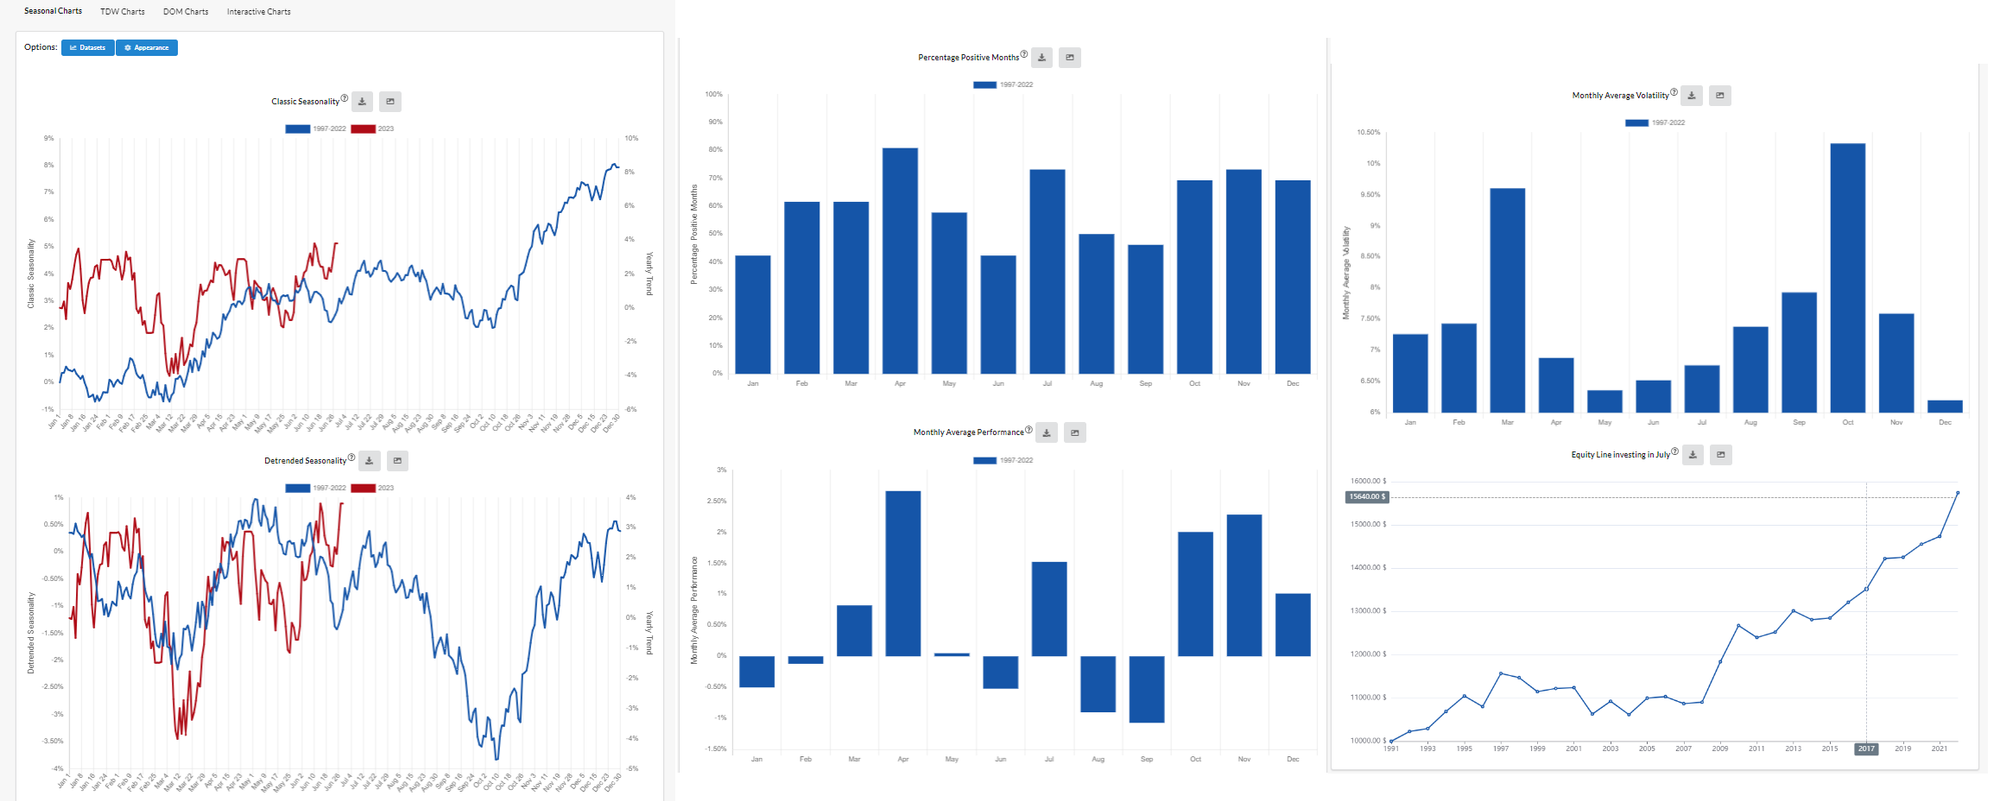
- Seasonality
- to analyze the average price movement in a calendar year
- to visualize the bullish and bearish Weekdays and Days of Month
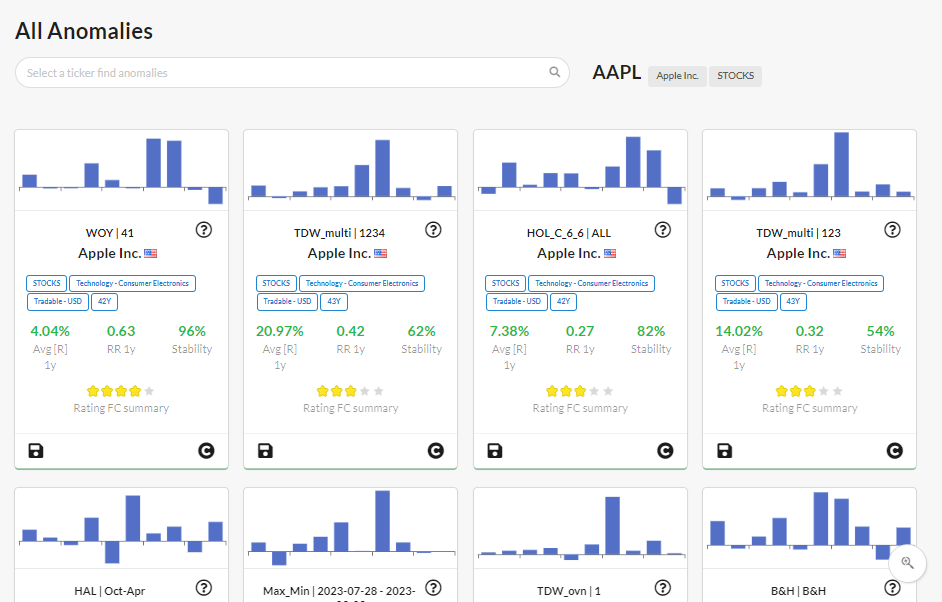
- Seasonal Anomalies
- to analyze backtests of trading strategies
- to exploit anomalous returns through Metatrader 4 Expert Advisors
ForecastCycles
Get the latest trends on the market